Intro
This is a website to display my final product for ISM for the year of 2020-2021. It will include a link to all of my codes through the website Github, description of each code, its output and ideas for future codes. Here is the links to my four projects, Star, Luna, Lulu, and Moti.
My Github
The main reason I created this website is to effectively learn and apply the programming language Python this year, because of its importance in the astronomy field. Every professional I have talked to or contacted as mentioned this programming language, and by beginning to learn it myself in highschool, I will be able to create a good foundation for my collge years. After learning Python, I intend to complete a series of different projects on various topics related to astronomy, by focousing on different applications of various difficulty to show my understanding.
Star
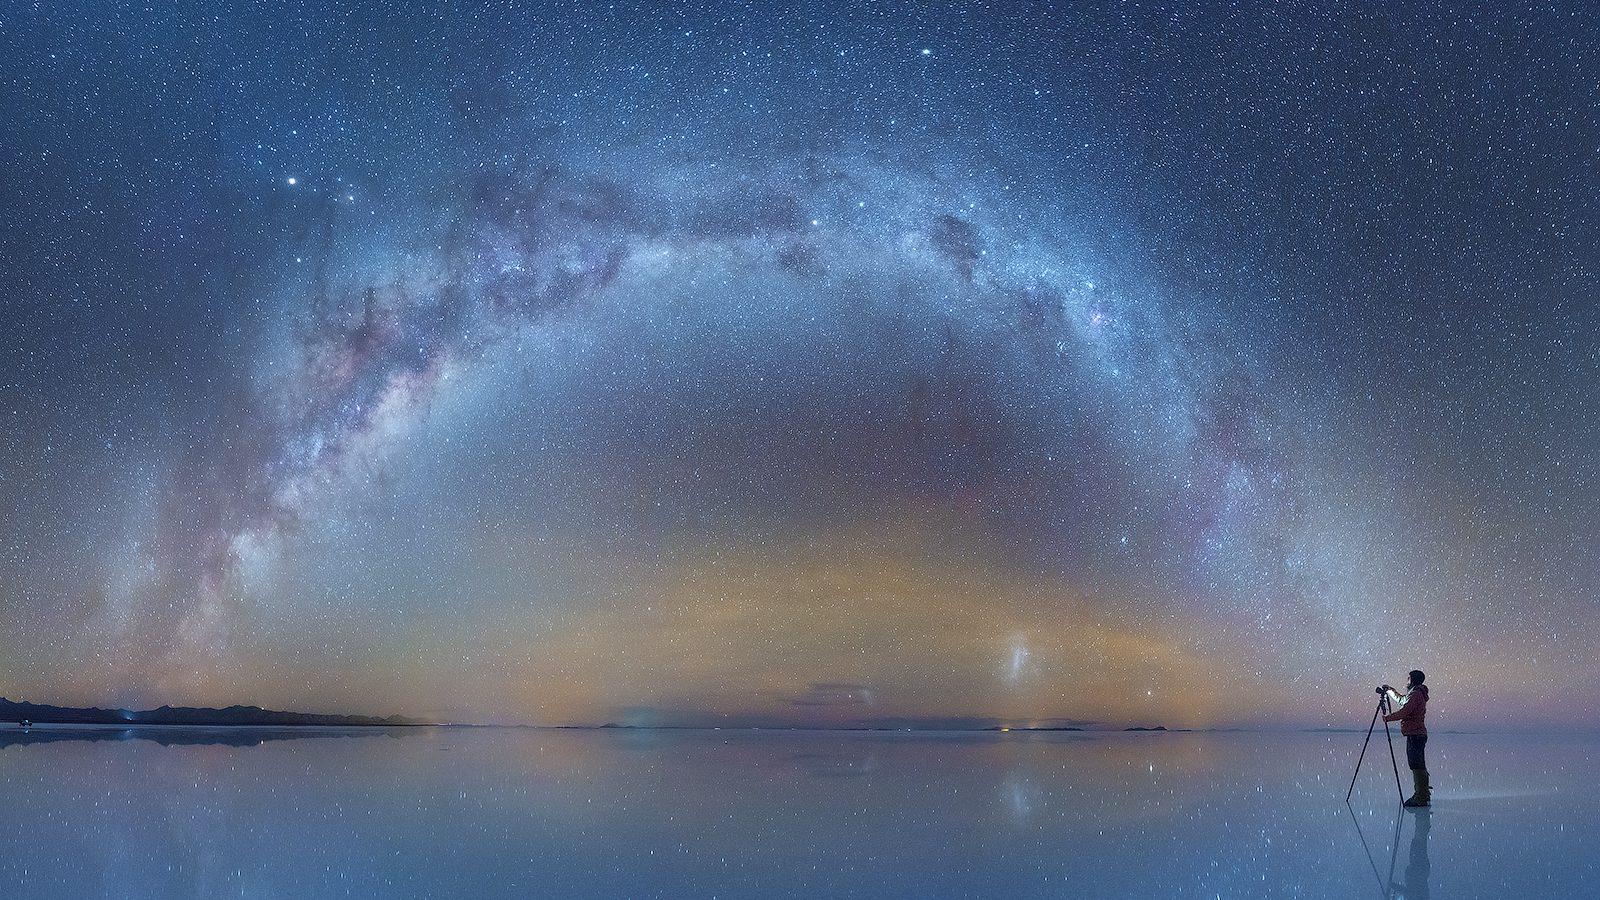
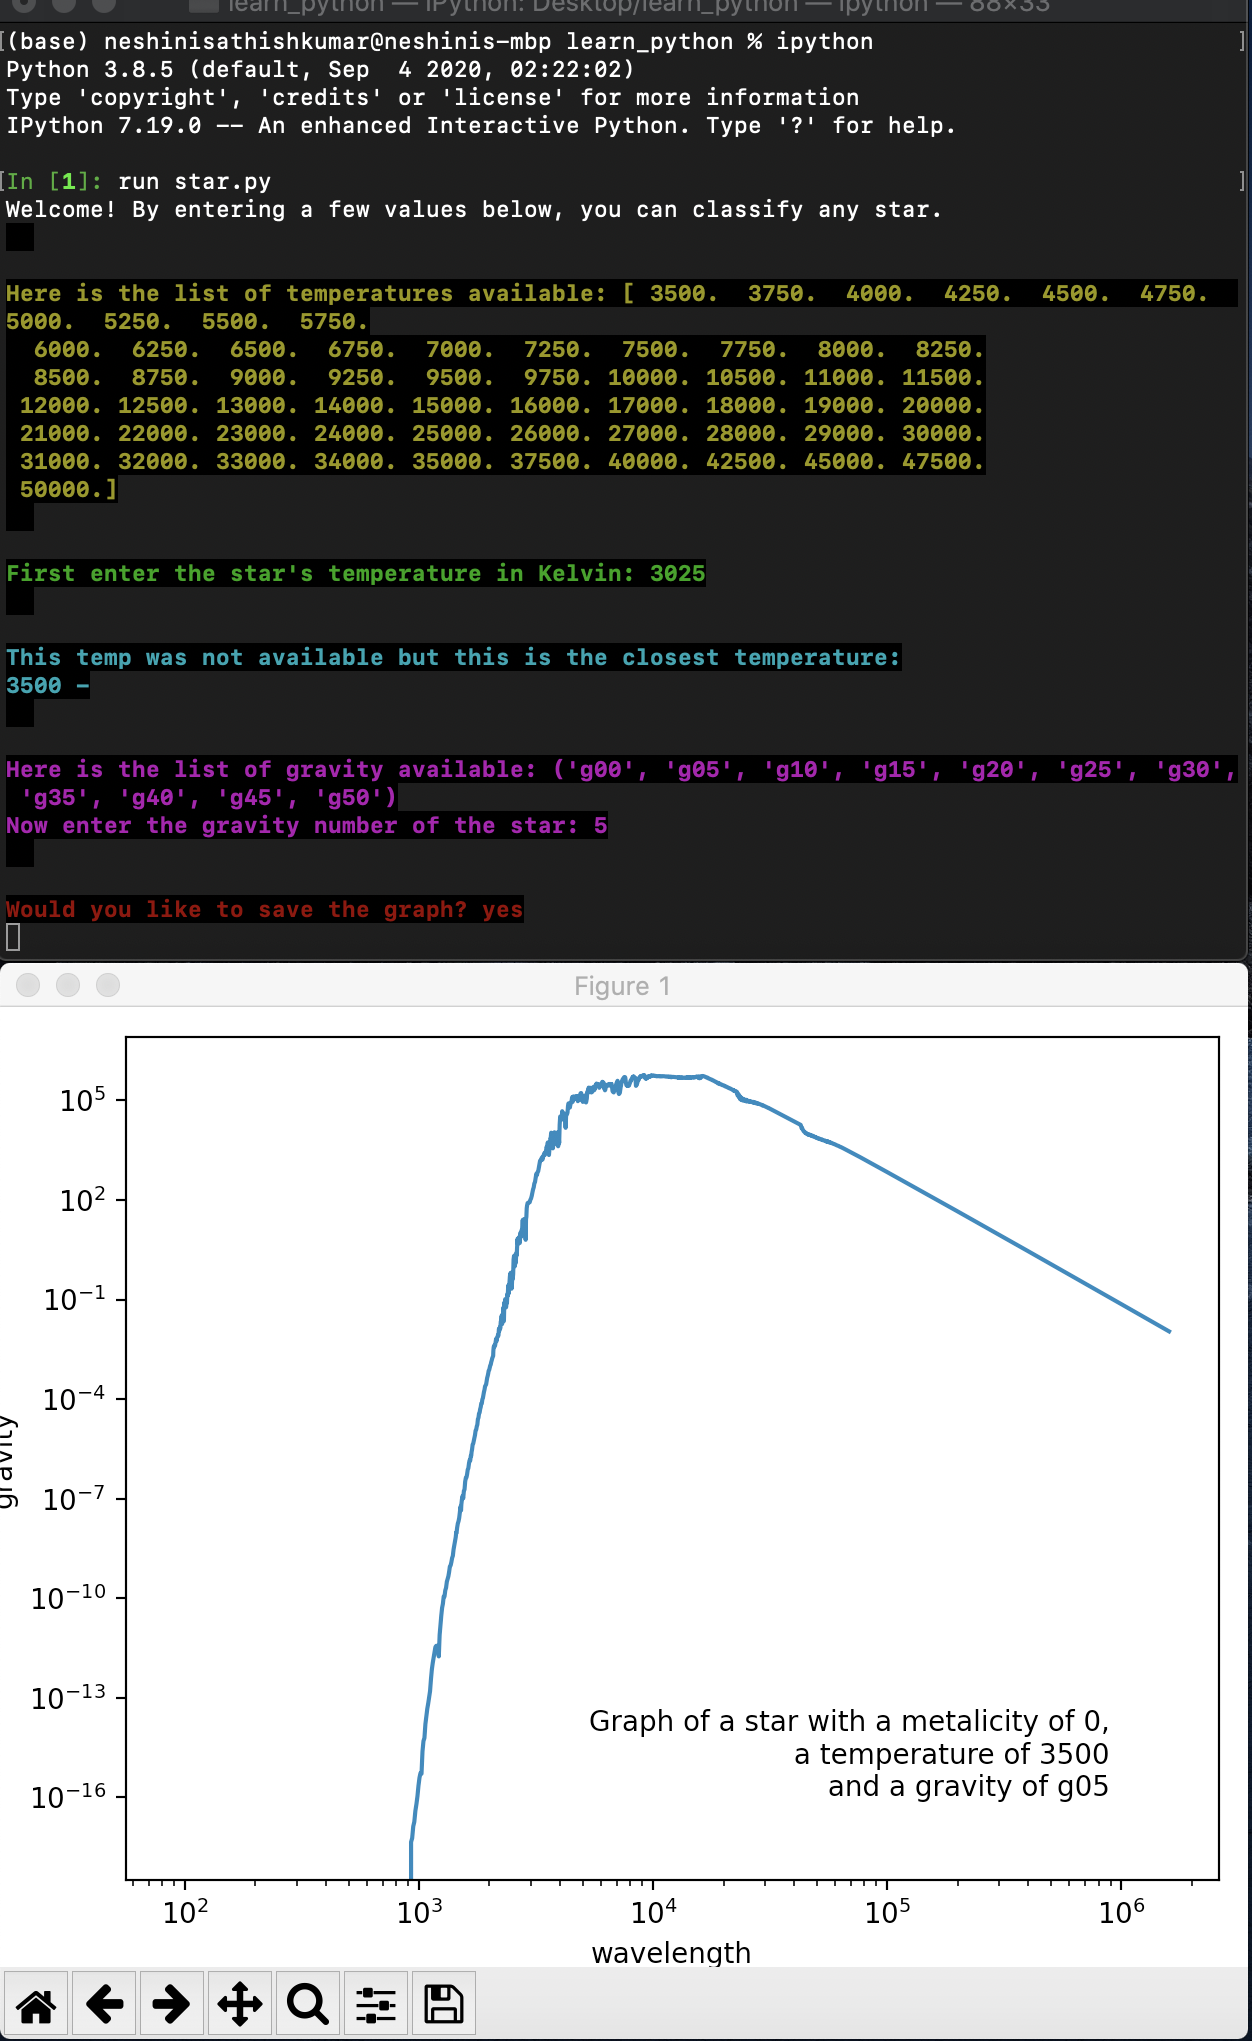
Abstract: The purpose of this project was to classify stars using the inputted temperature and gravity.
For this project, I used fits files from the Mikulski Archive Website and where the readme description defines each variable available and how to use it.
Through this project, I learned how to read in fits files, read user inputted values and use the these values to find and display information from a particular file. Using that file, I learned to plot the given information to create a graph of a star's Wavelength vs Gravity.
You can find the entire code for this star project, along with it's readme and output in my Github:
Here
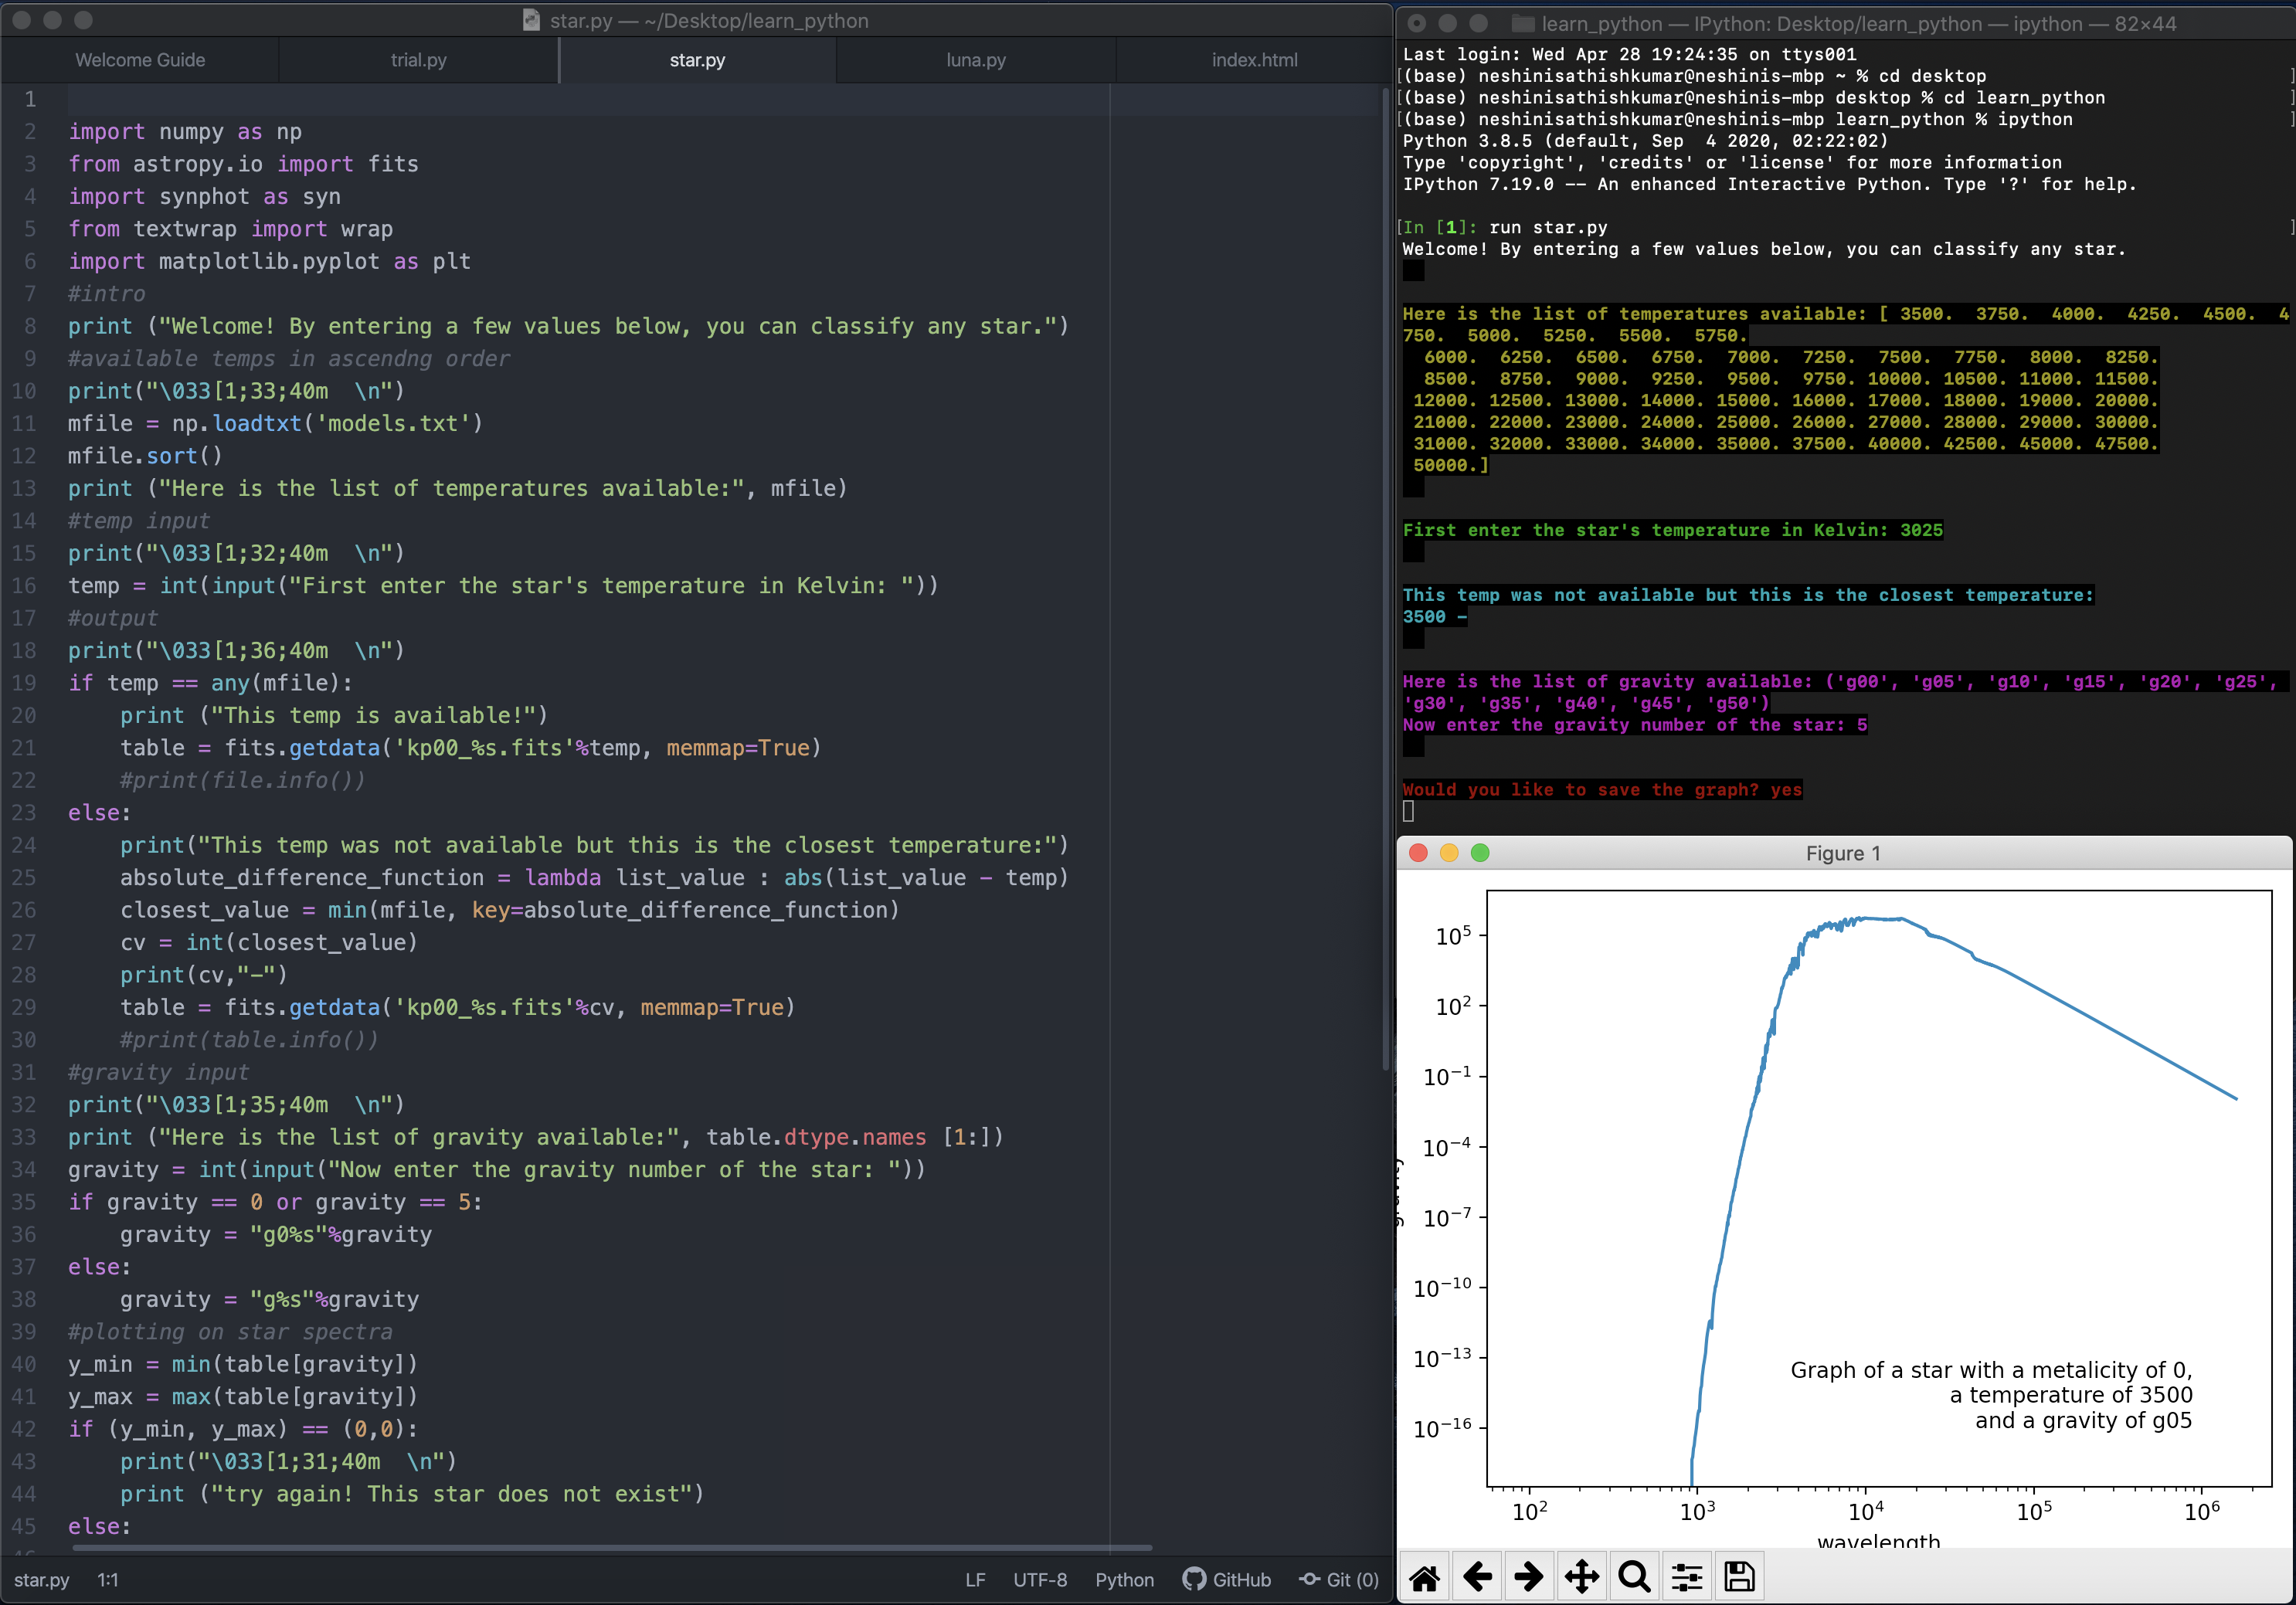
Snippet of code and functions used:
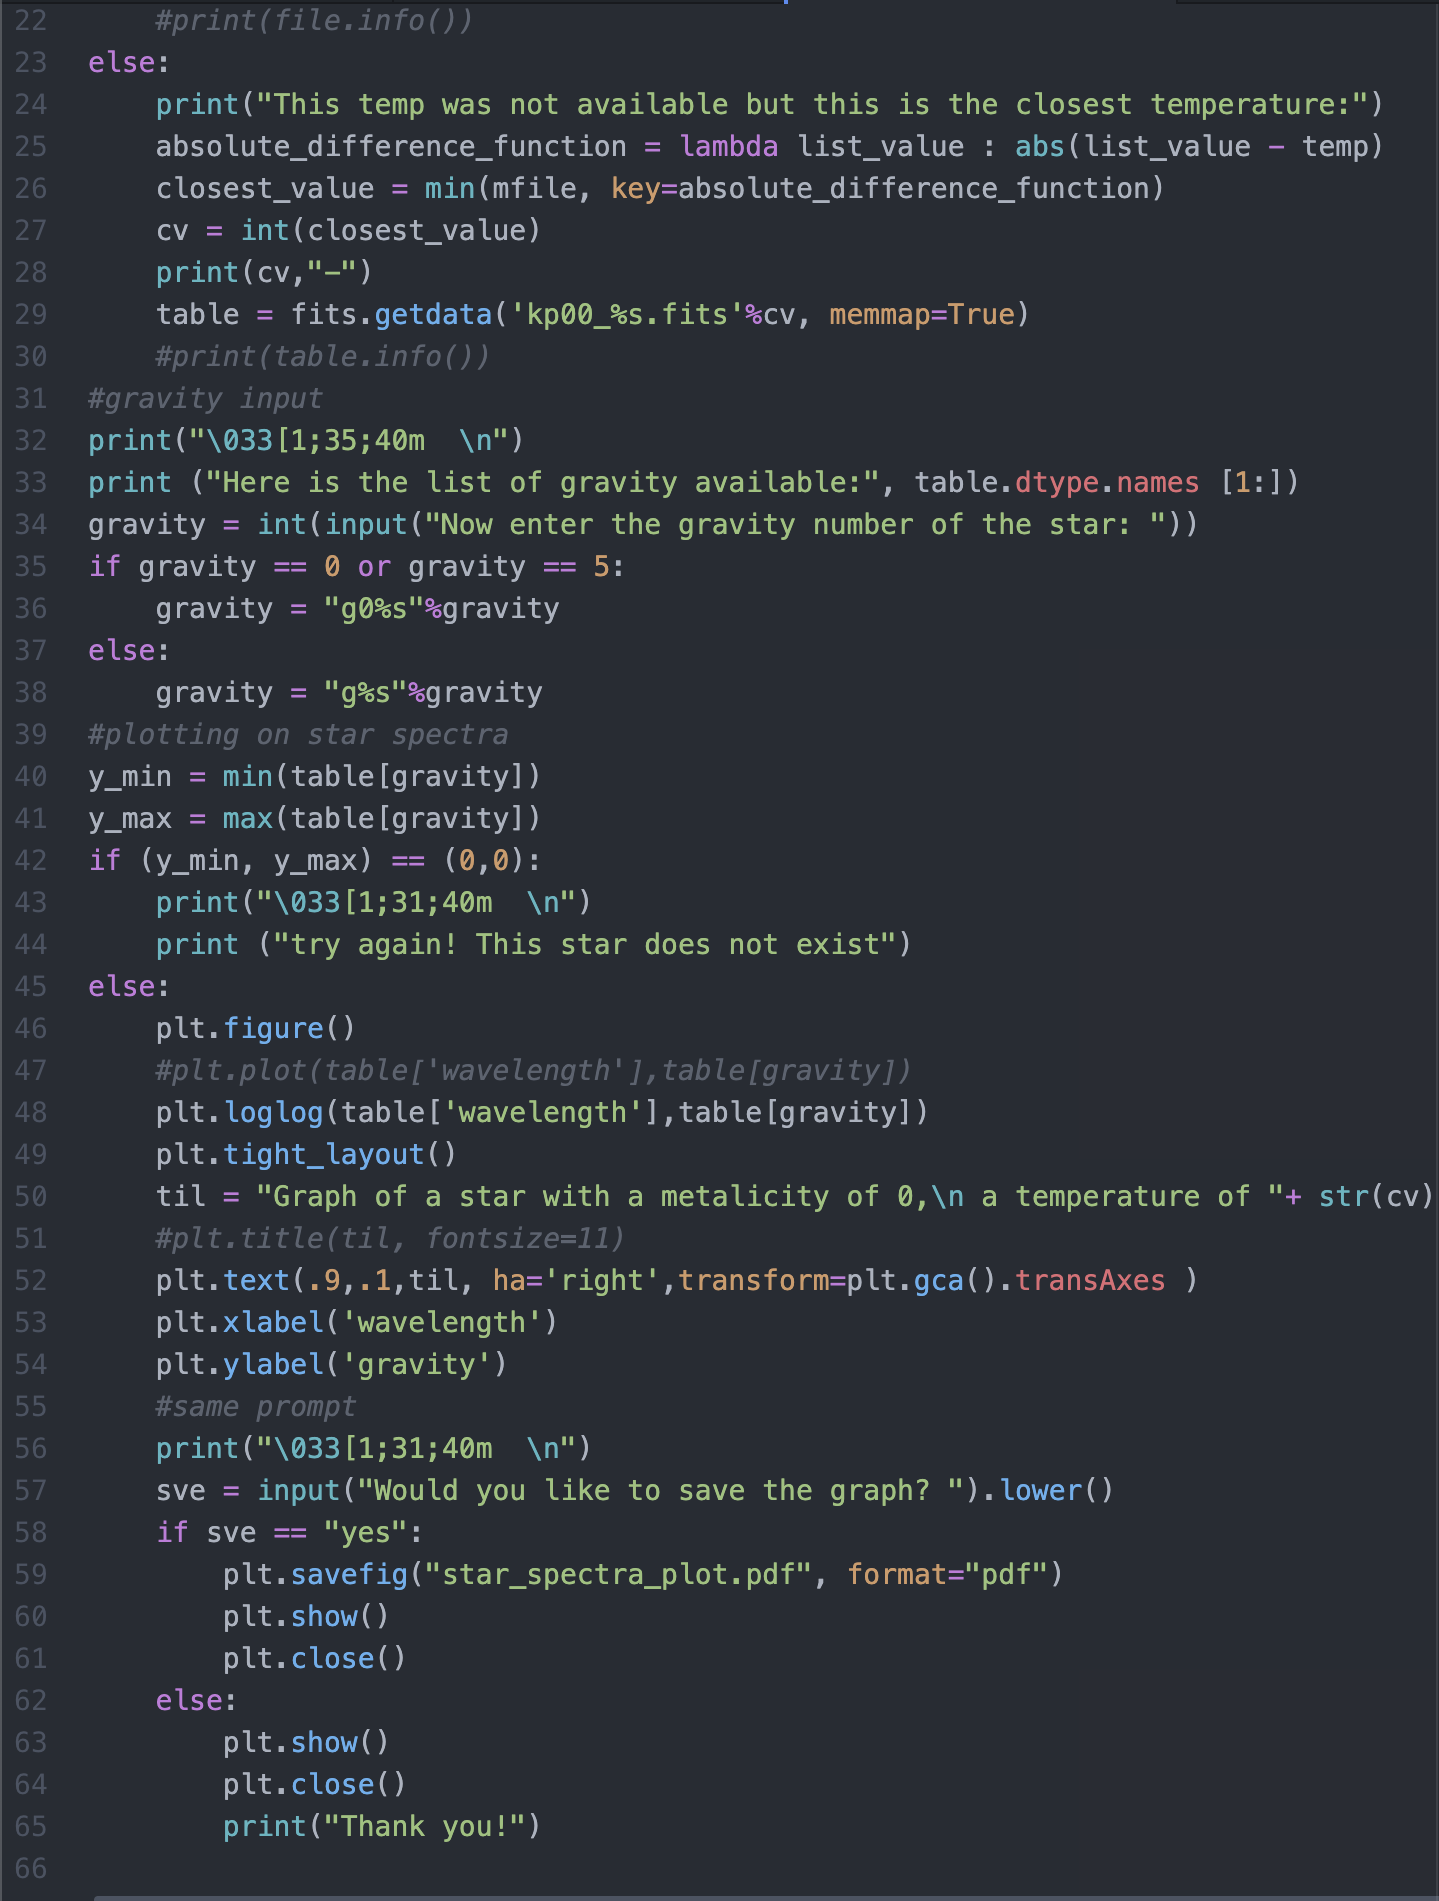
This code uses the following functions throughout:
np.loadtext() - to read in files
file_name.sort() - to sort the files
input() - to read the user's inputed value
fits.getdata() - to get the data within a fits file
if, else statements - to create conditions
pl.figure() and plt.loglog() - to create a graph and plot the values
plt.savefig() - to save the figure created
Final Output
Luna
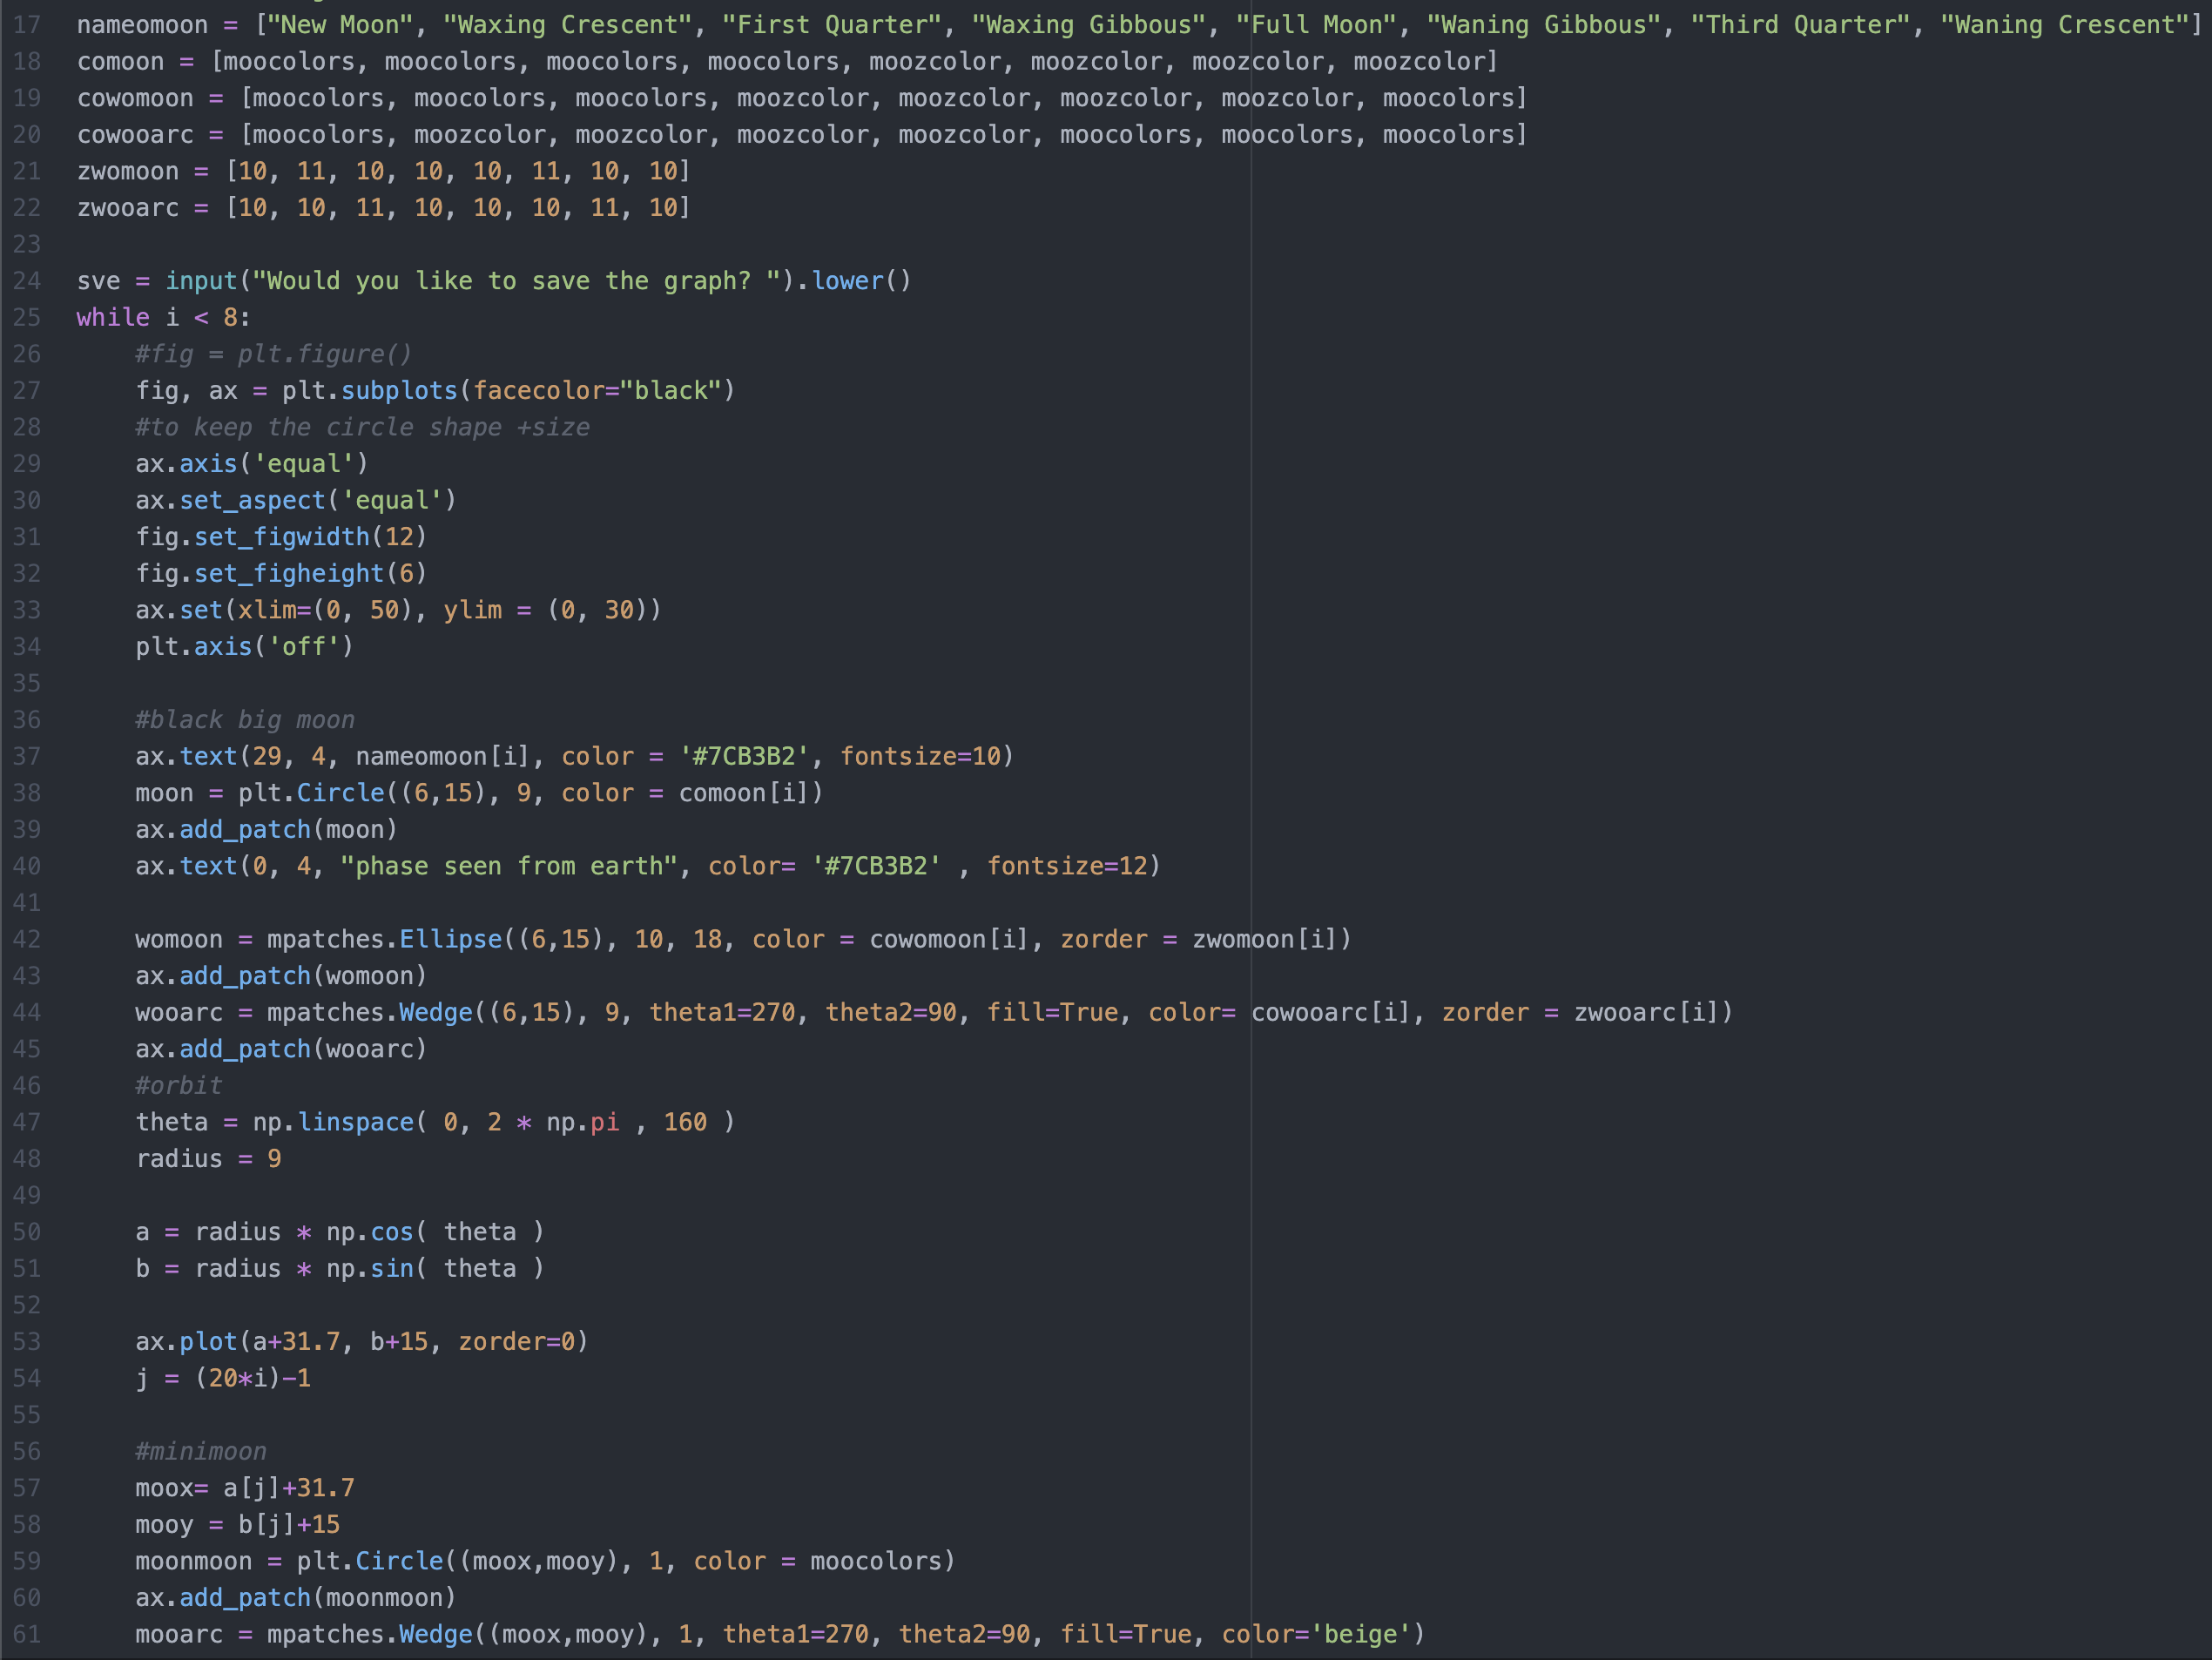
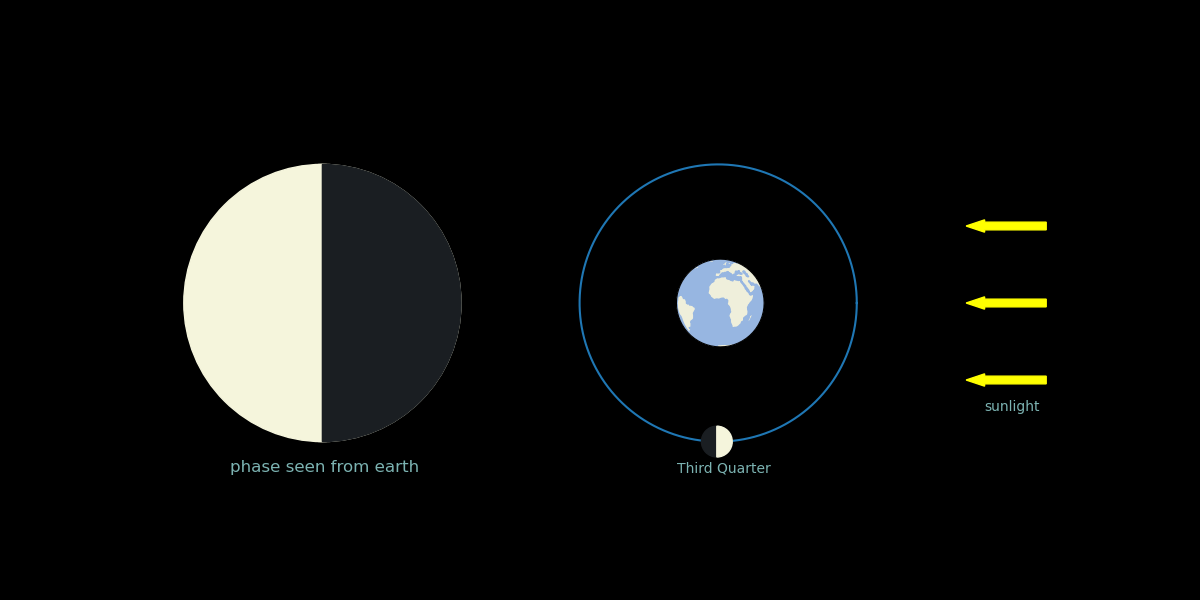
Abstract: The purpose of this project was to visually show the position of the moon around the earth and it's lunar phases.
For this project I used Zingale's phase.py code as an initial referance to start my project.
Through this project, I learned how to draw and plot various shapes to get my desired output, add text to a plot, use cartopy and create and move subplots.
You can find the entire code for this luna project, along with it's readme and output in my Github:
Here
Snippet of code and functions used:
This code uses the following functions throughout:
plt.subplots() - to create a subplot
np.linspace() - to create an evenly spaced sequence for the specified interval
plt.axis() - to edit the plot's axis
plt.Circle() - to create a circle with the specified parameters
ax.text - to add text to the plot
mpatches.Ellipse() and mpatches.Wedge() - to create an ellipse and wedge patch
ax.add_patch() - to add a patch created
ccrs.Orthographic() - to show the map of the earth in the shape of a circle
art.add_feature() - to add a feature to the map created
Final Output
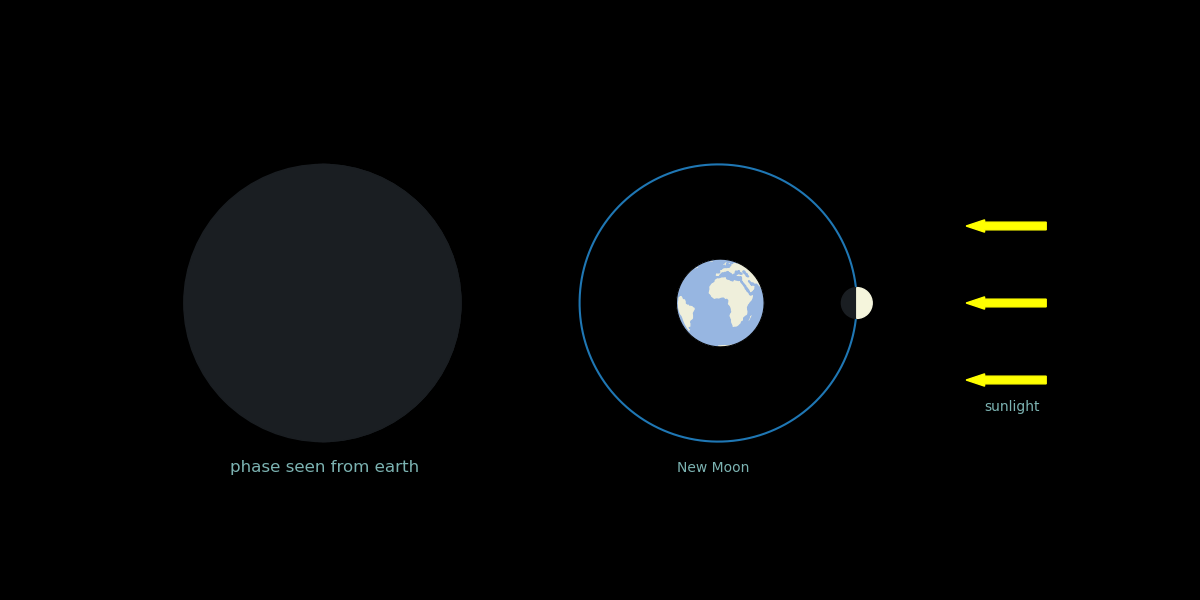
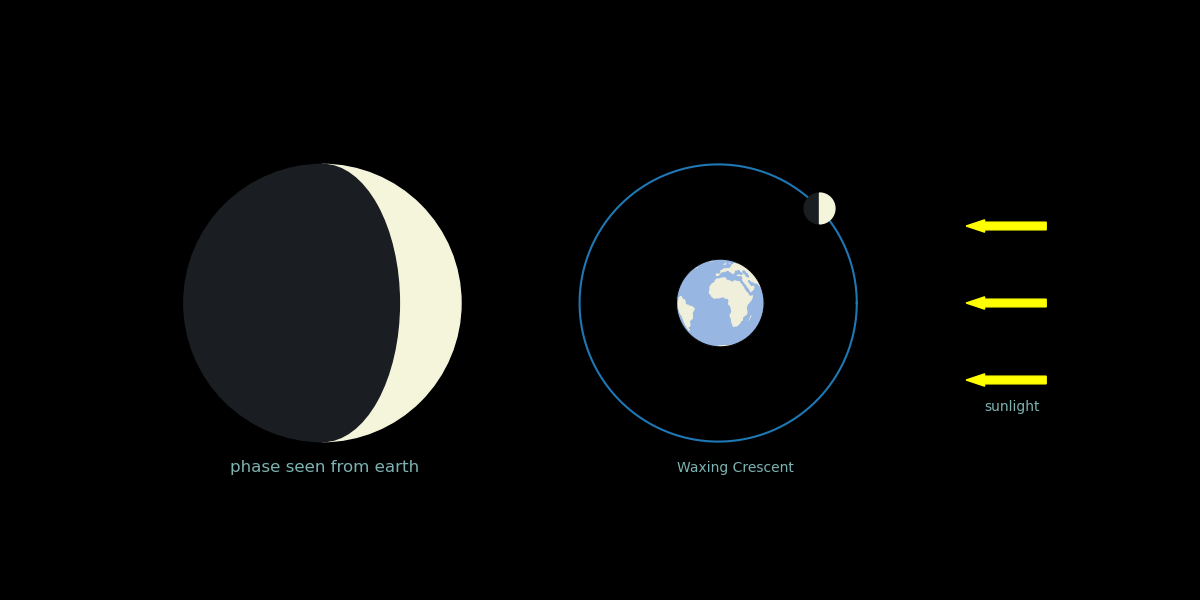
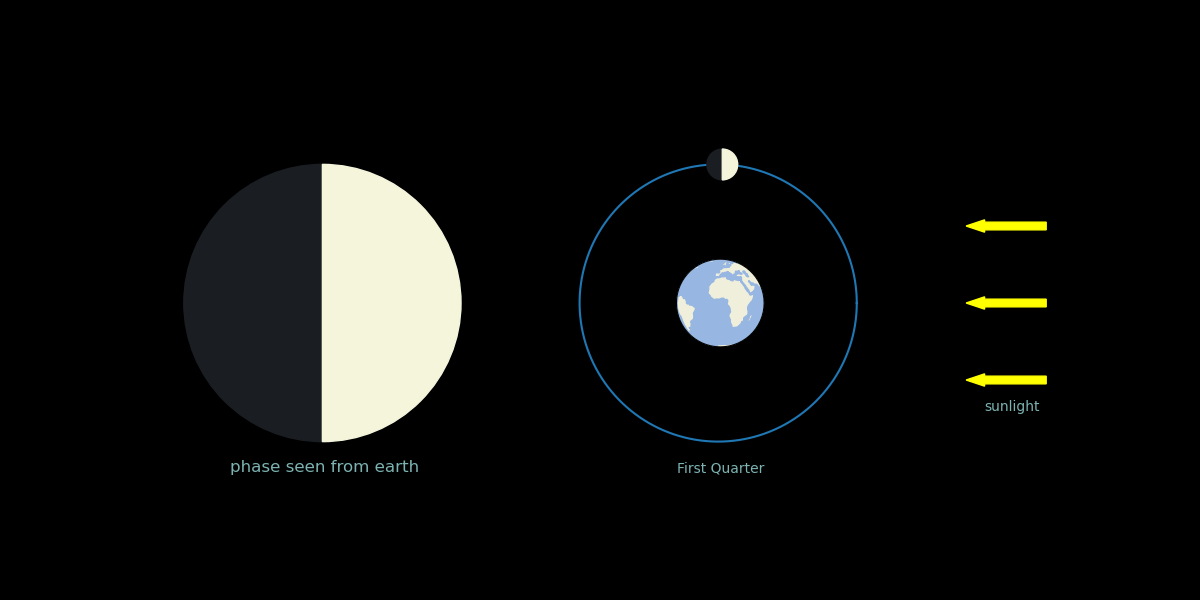
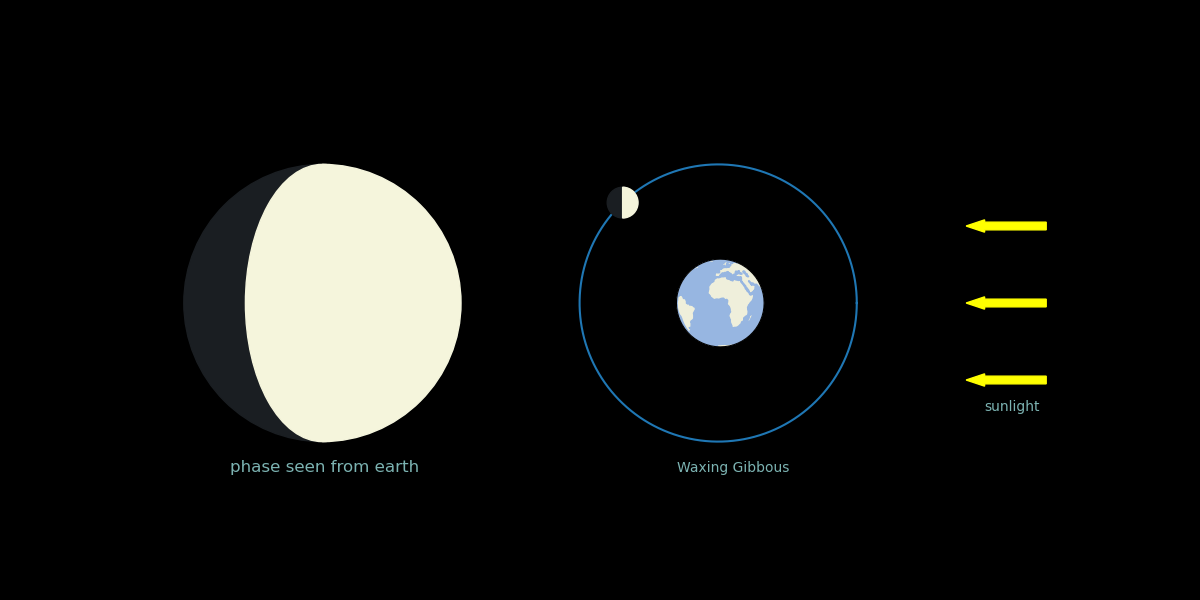
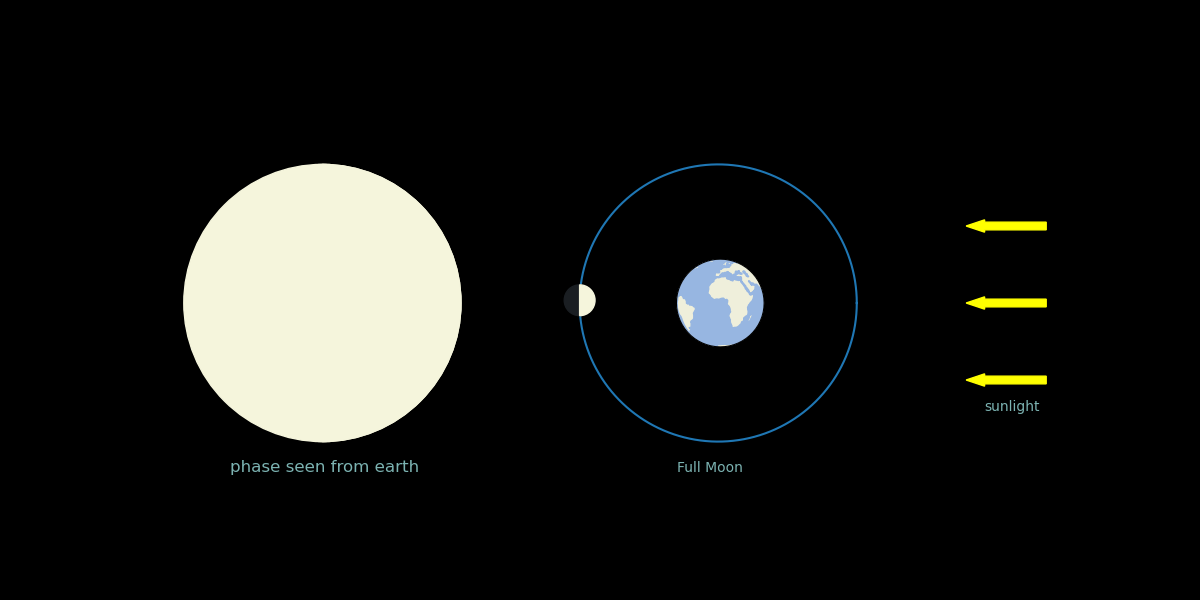
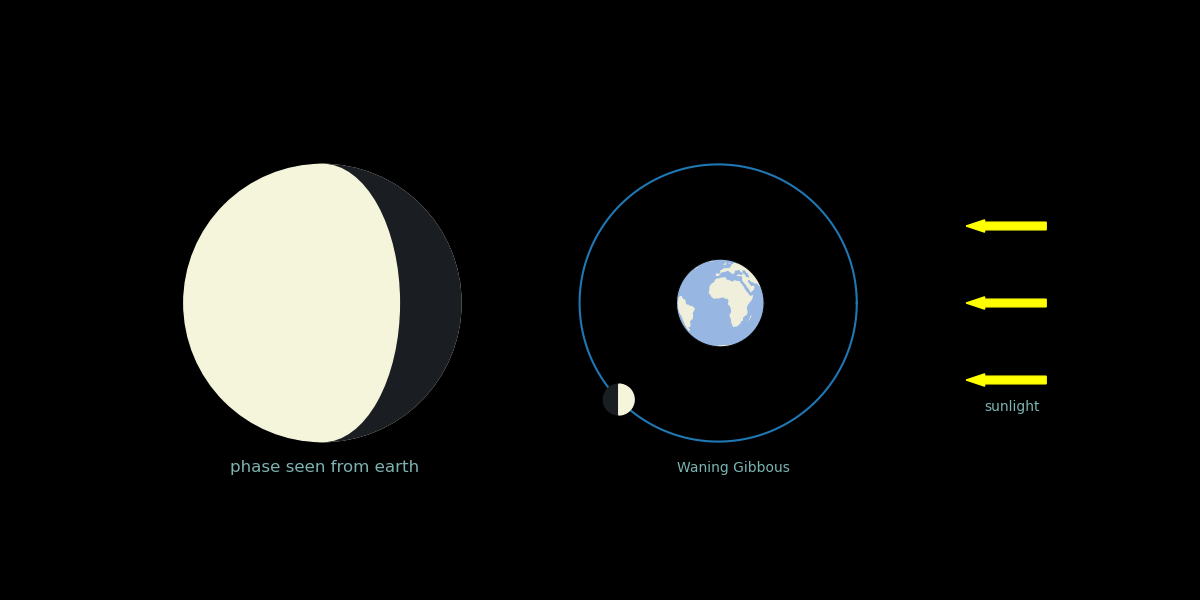
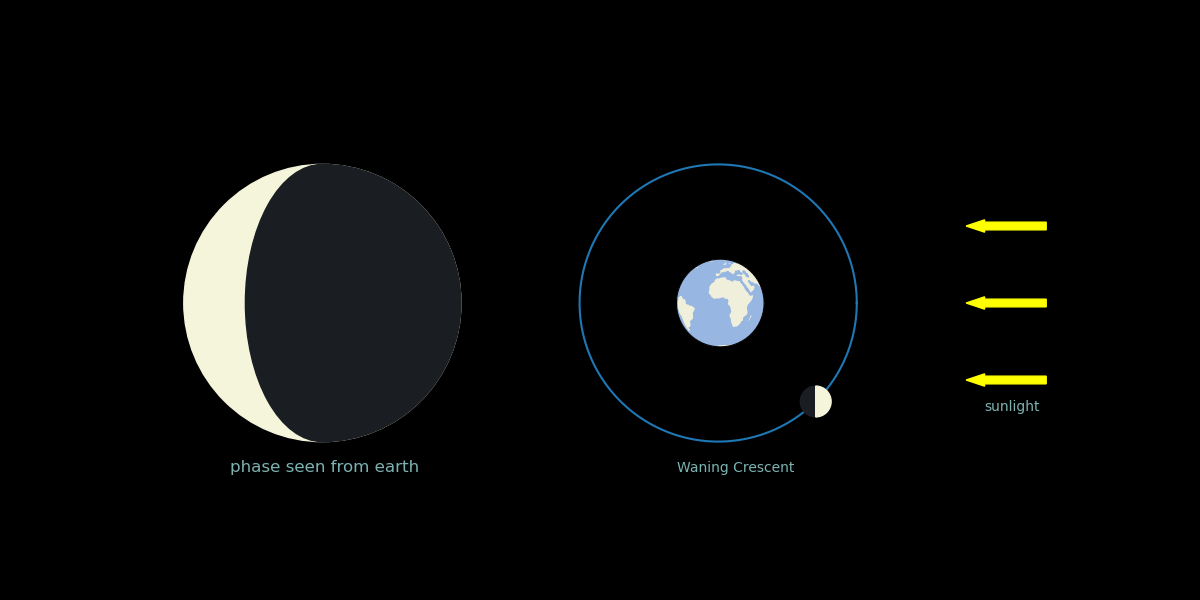
And when all of this individual figures are put in order and turned into a gif, we get:
Lulu
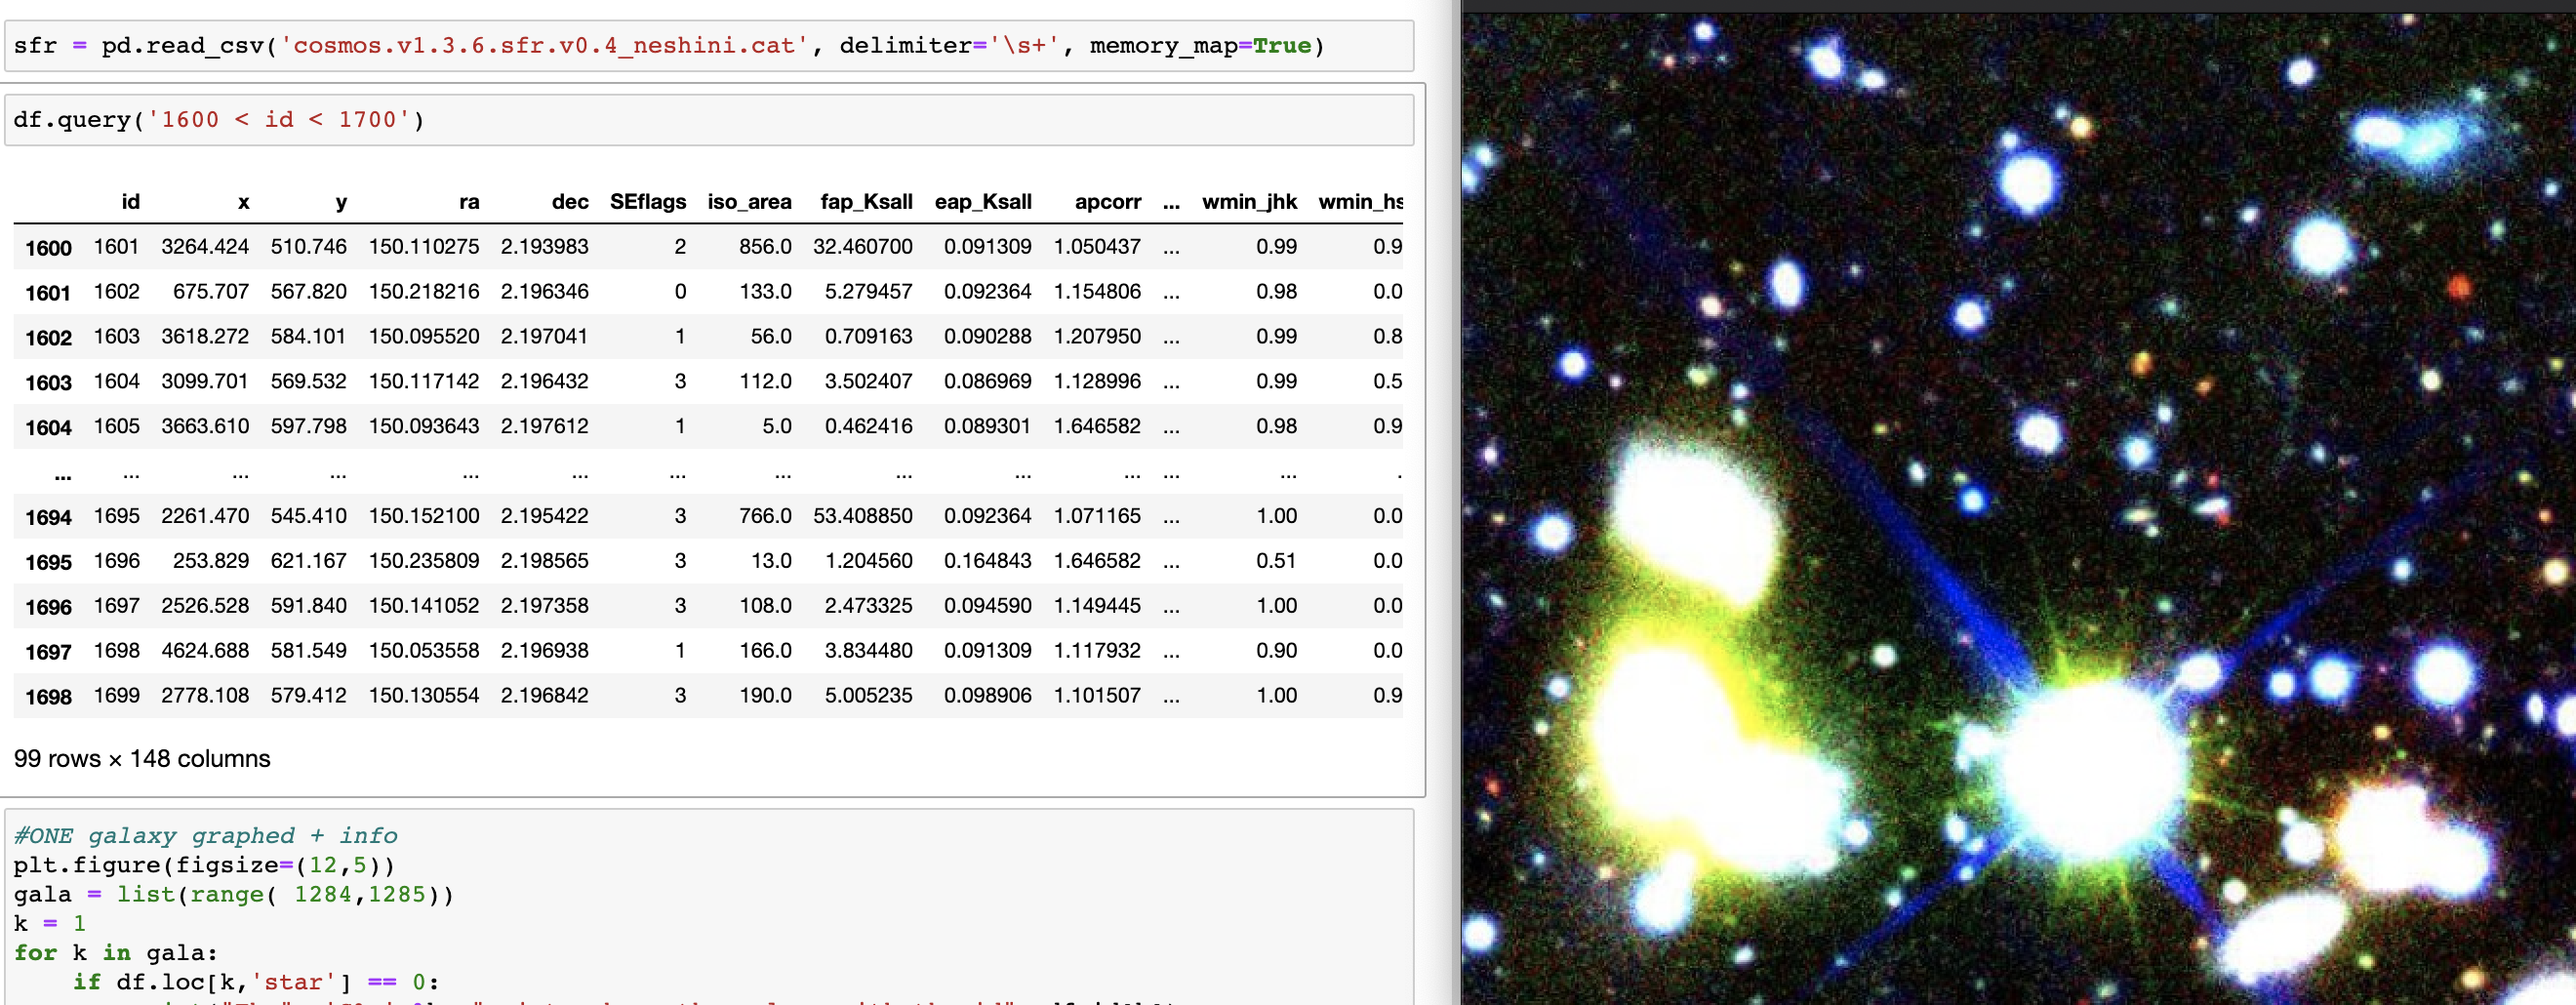
Abstract: The purpose of this project was to be able to read in, understand and organize large datasets into graphs that display the information from it clearly.
For this project, I used Zfourge to get three different datasets, CFS, COSMOS and AGN. Zfourge stands for The FourStar Galaxy Evolution Survey aand is a large and deep medium-band imaging survey aimed at establishing an observational benchmark of galaxy properties at redshift z > 1.
Through this project, I learned how to use pandas to read in a dataset, create smaller tables from a large dataset and then plot a scatterplot using information from three different datasets.
You can find the entire code for this lulu project, along with it's readme and output in my Github:
Here
Snippet of code and functions used:
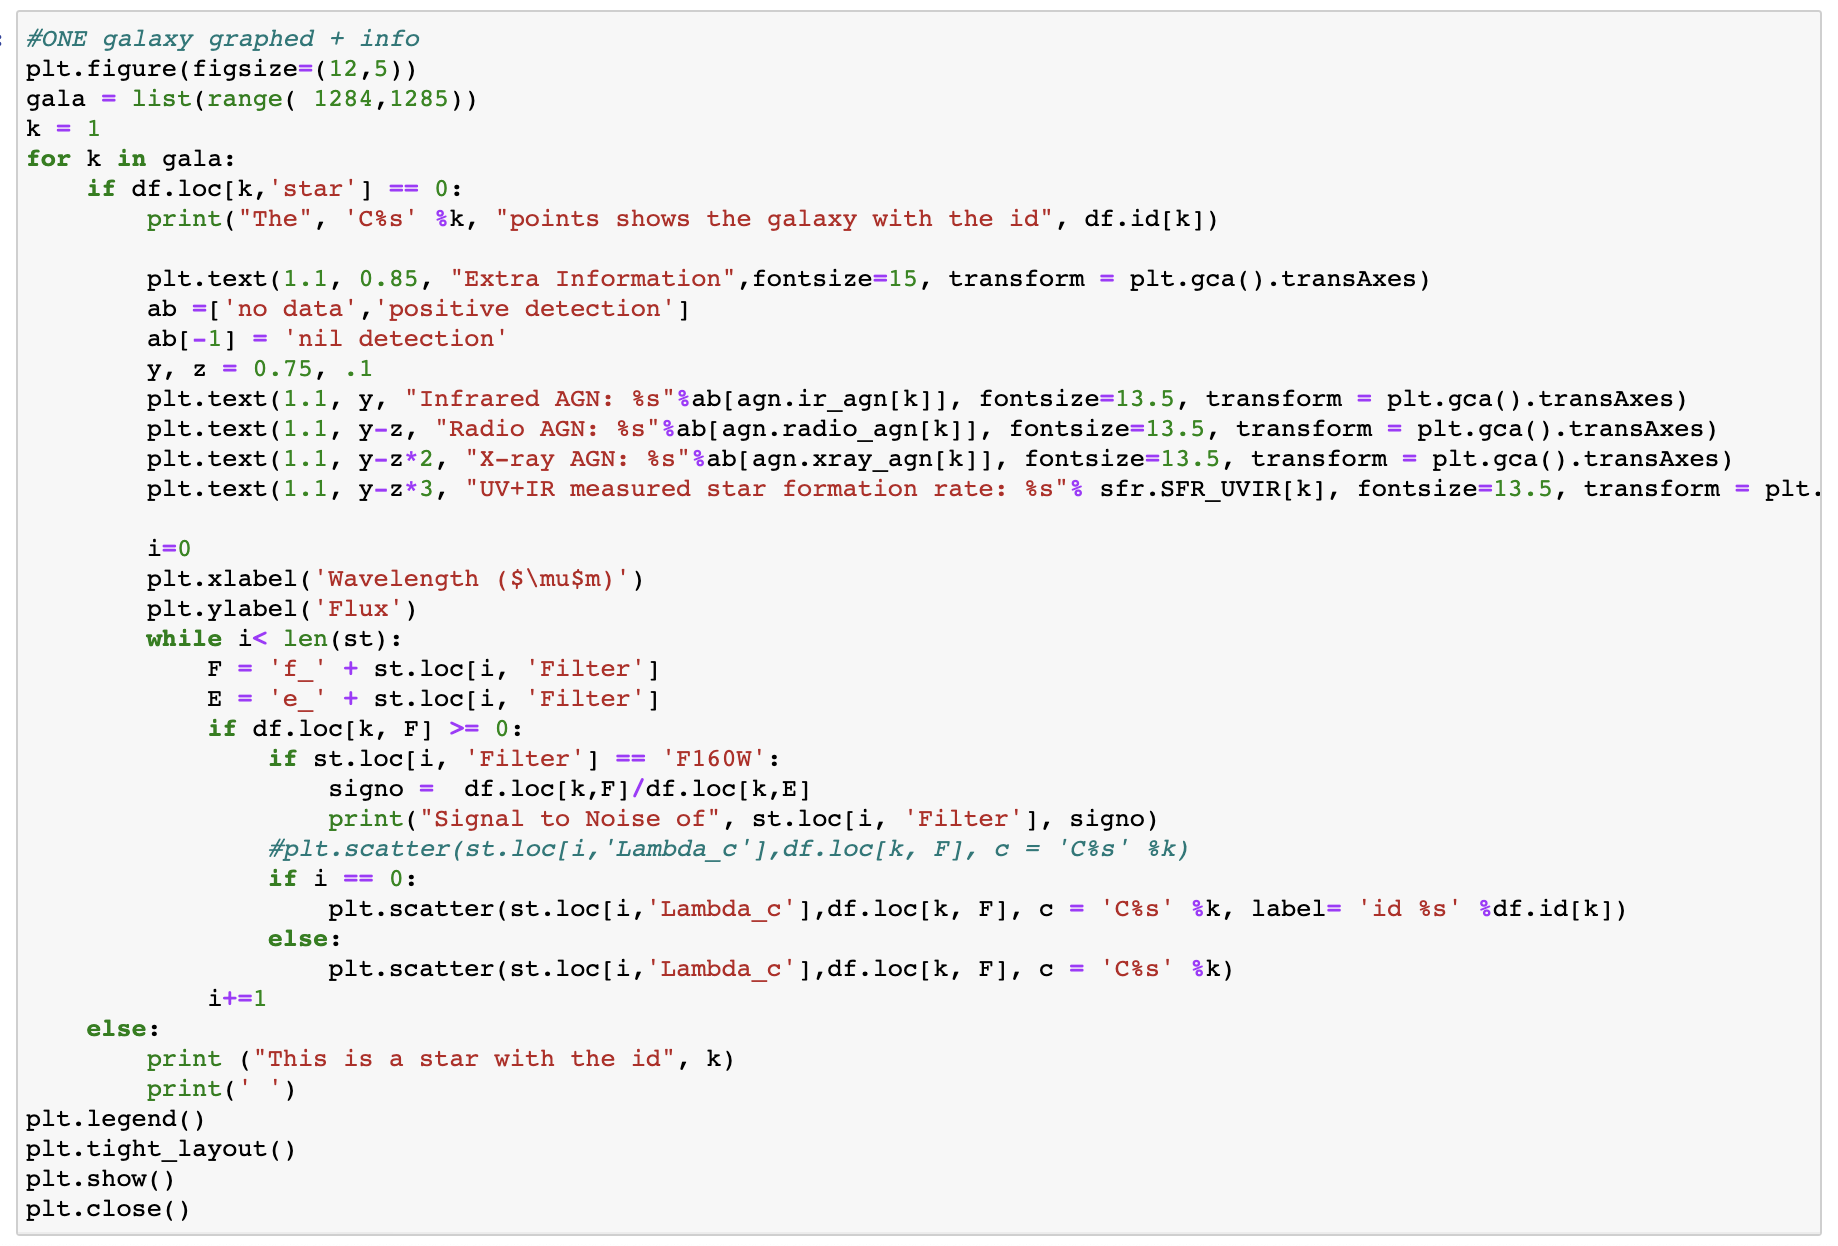
This code uses the following functions throughout:
pd.read_csv() - a panda function used to read a large csv files
list(range()) - to create a list of values
for function - used to work through a sequence (like a range, string or dictionary)
plt.text() - add text to a plot
plt.scatter - to create a scatter plot using the range of values specified
plt.legend() - to create a legend for the plot
Final Output
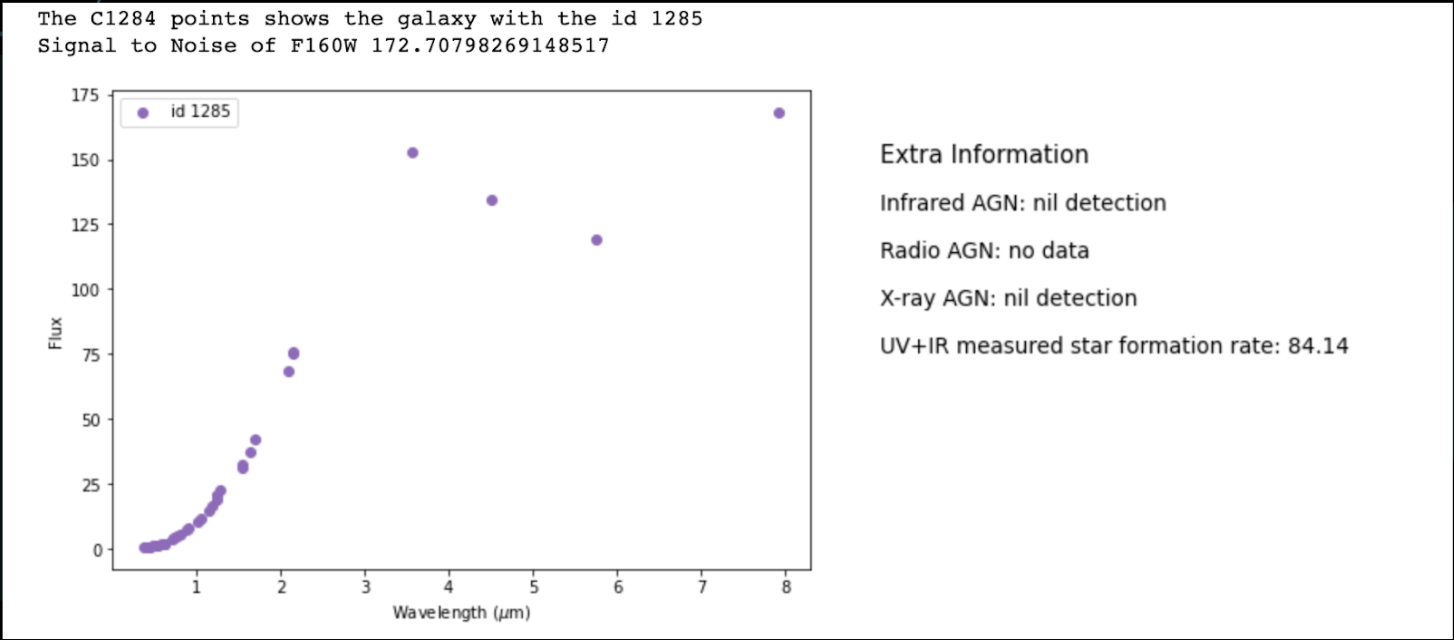
This plot graphs and shows the information for one particular galaxy of id 1285.
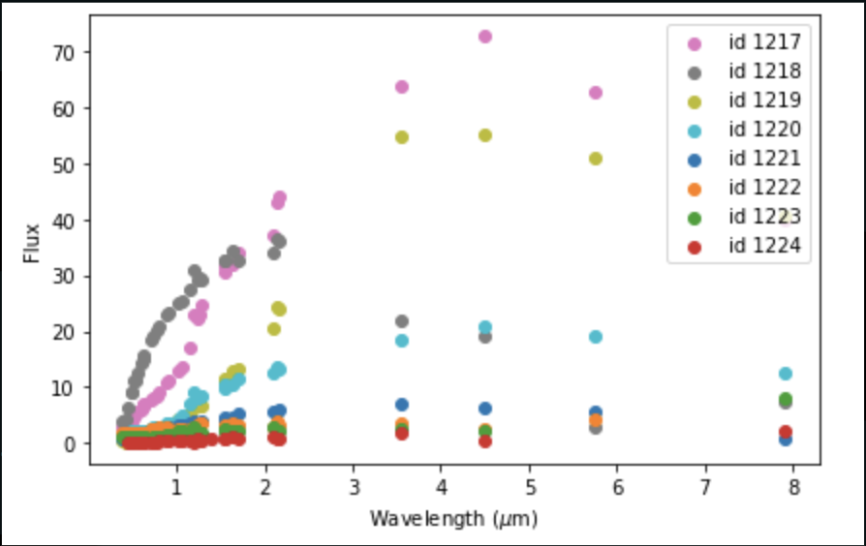
This plot graphs and multiple galaxies together to be able to compare their wavelength vs flux shape.
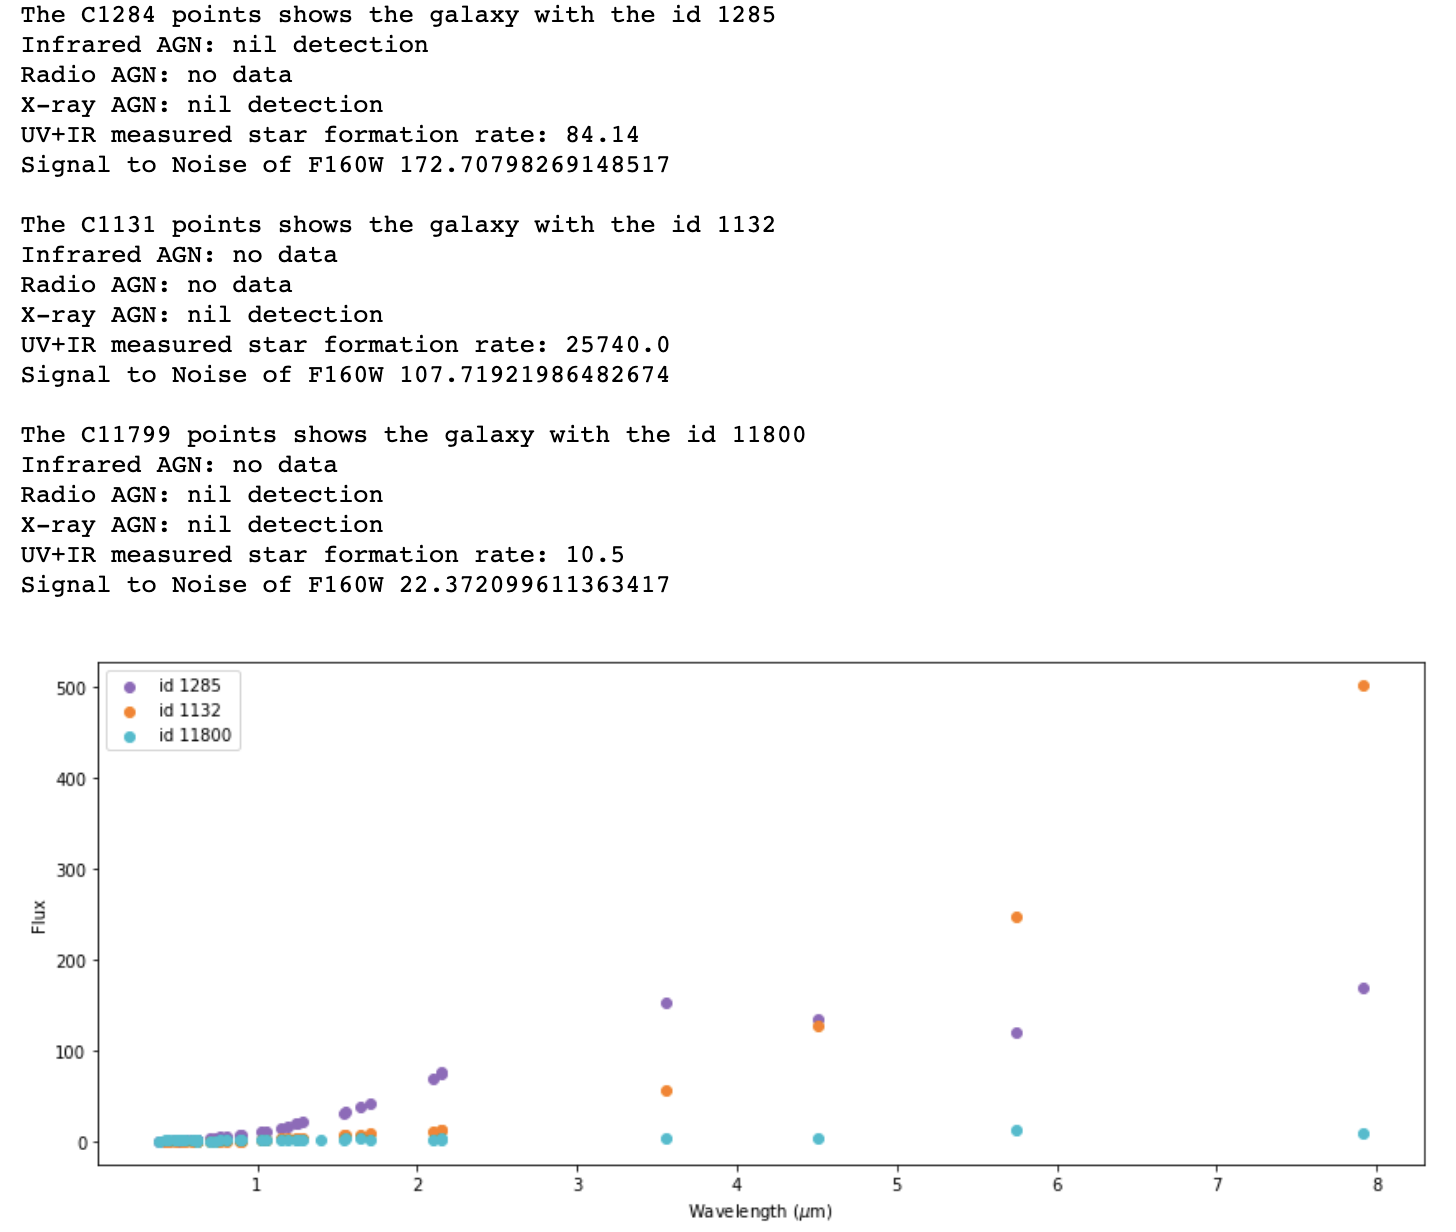
This plot special galaxies along with the information related to them. The galaxy with id 1285 is an example with non negative values for UV+IR measured star formation rate. The galaxy with id 1132 is an example of a galaxy with high star formation rate. The galaxy with id 1132 is an example of a source with a good z spectrum rate (i.e. not -99).
Moti
Abstract: The purpose of this project was to calculate the gravity of a celestial object, given its mass and radius, then to plot the projectile motion of a ball being thrown on that celestial object at the specified parameters.
For this project, I used basic physics to find the gravity and calulate its motion.
Through this project, I learned how to apply physics principles to calulate the gravity and projecile motion through code. Then I learned how to plot the projectile motion of a ball being thrown at the specified parameters. And lastly, I learned how to create a library and animate a plot.
You can find the entire code for this moti project, along with it's readme and output in my Github:
Here
Snippet of code and functions used:
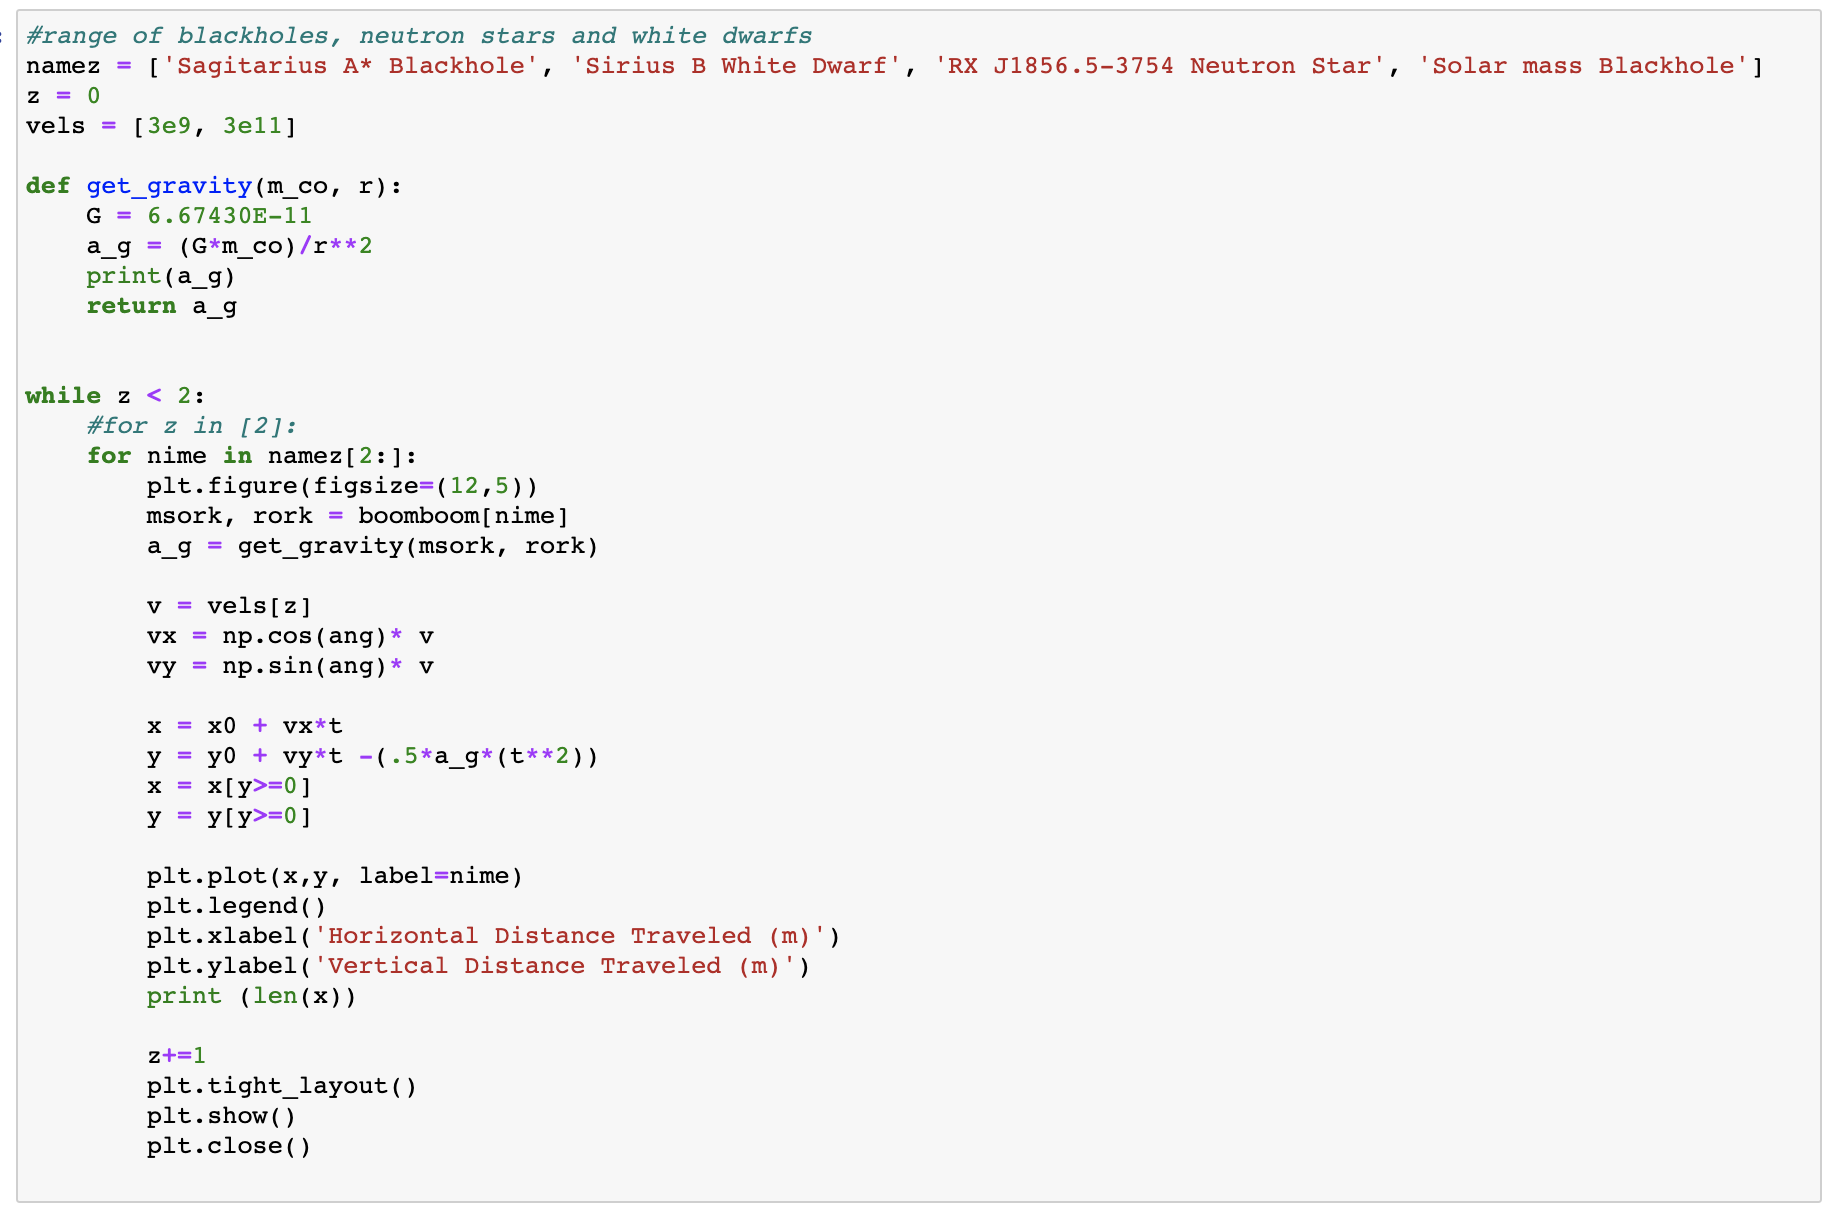
This code uses the following functions throughout:
def functionname (): and return [expression] - to define a function for a specific parameters
np.radians() - to convert the measure of degrees into radians
np.linspace() - to create an evenly spaced sequence for the specified interval
dictionaryname = {'key': [variable]} - to create a dictionary to store multiple variables and a 'key' to use them
if,else and while functions - to create conditions within the code
variable = input() - to get a user's inputted value
axe.set_data() - to set the data for a plot or variable
anim = animation.FuncAnimation() - to run the animation function
frames() - to edit the frames order, speed and more
Final Output
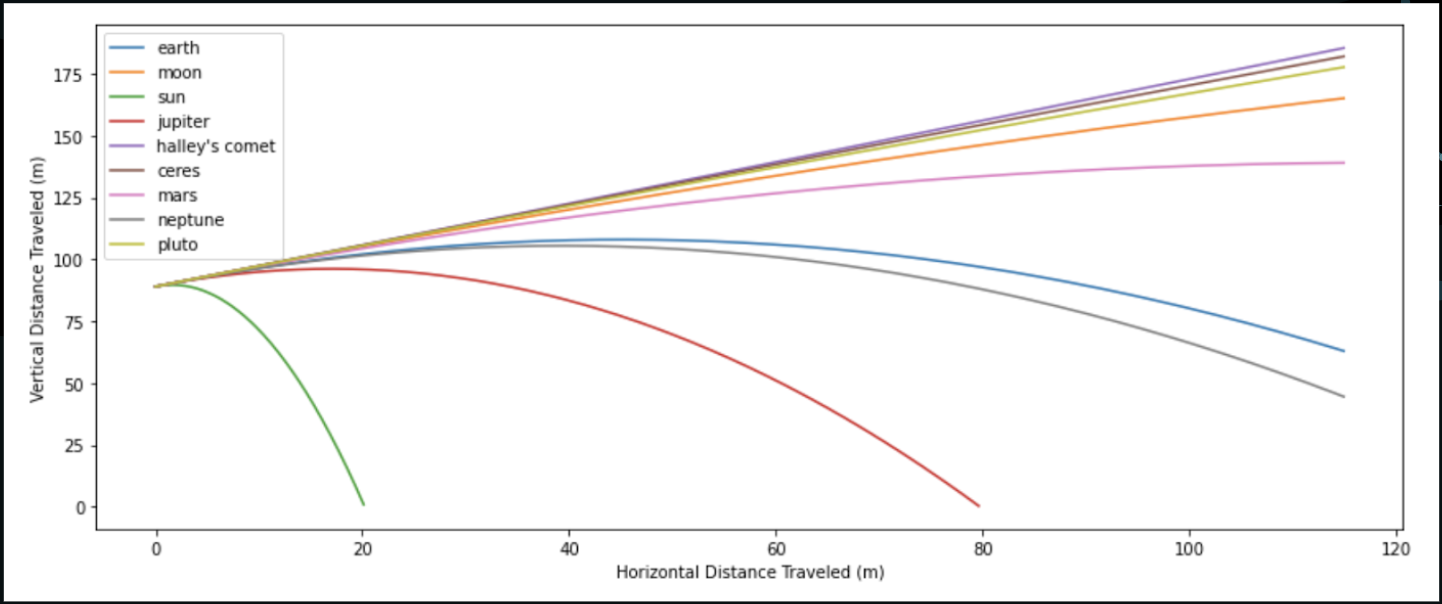
This plot graphs the projectile motion of a ball being thrown at a velocity of 5 m/s at an intitial vertical height of 1.7m on multiple celestial objects in the solar system.
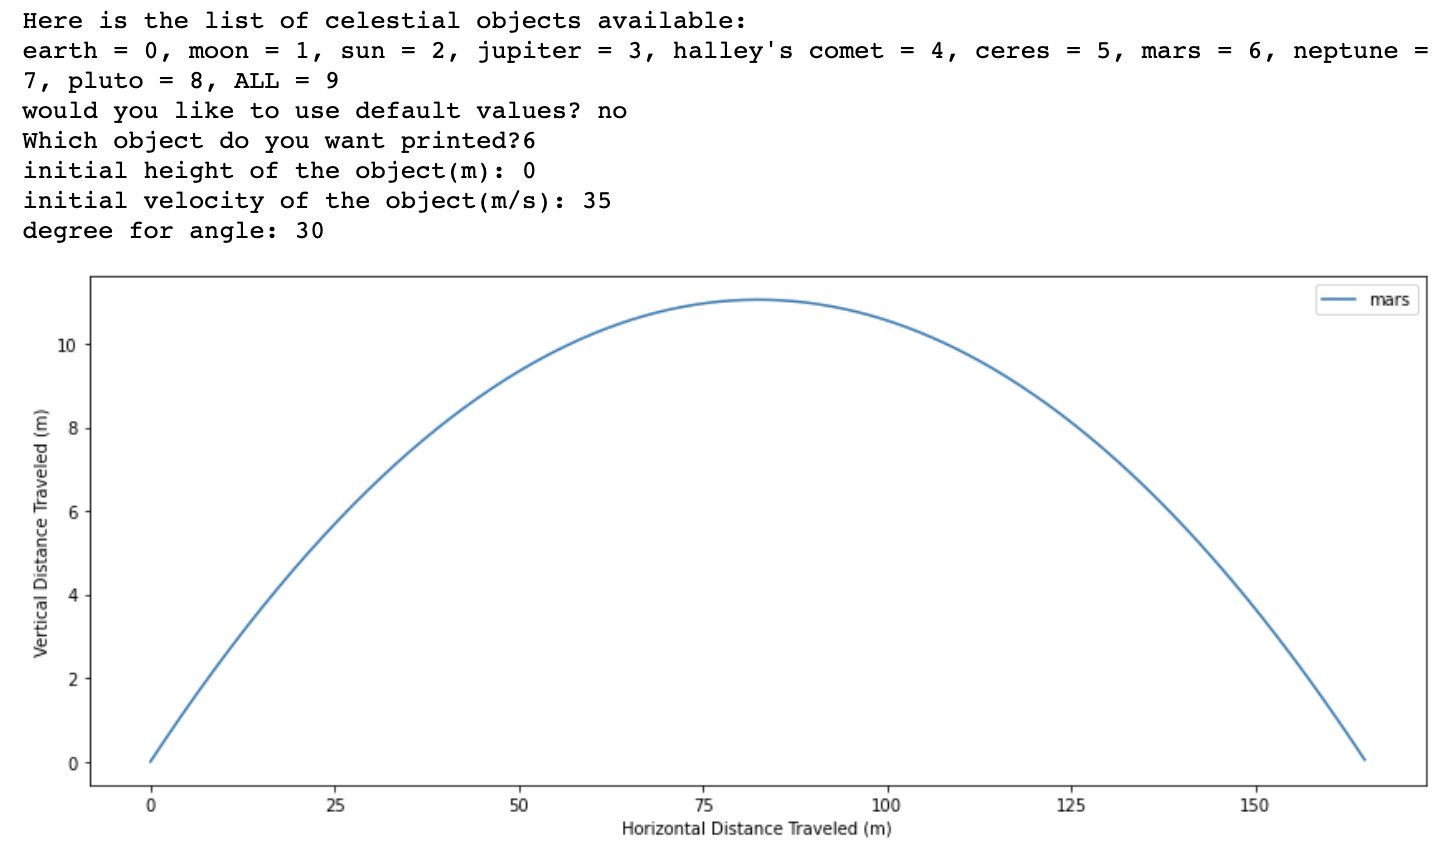
This plot graphs the projectile motion of a ball being thrown on a user inputted object, intital height, velocity, and degree for angle (where degrees =40 as default.
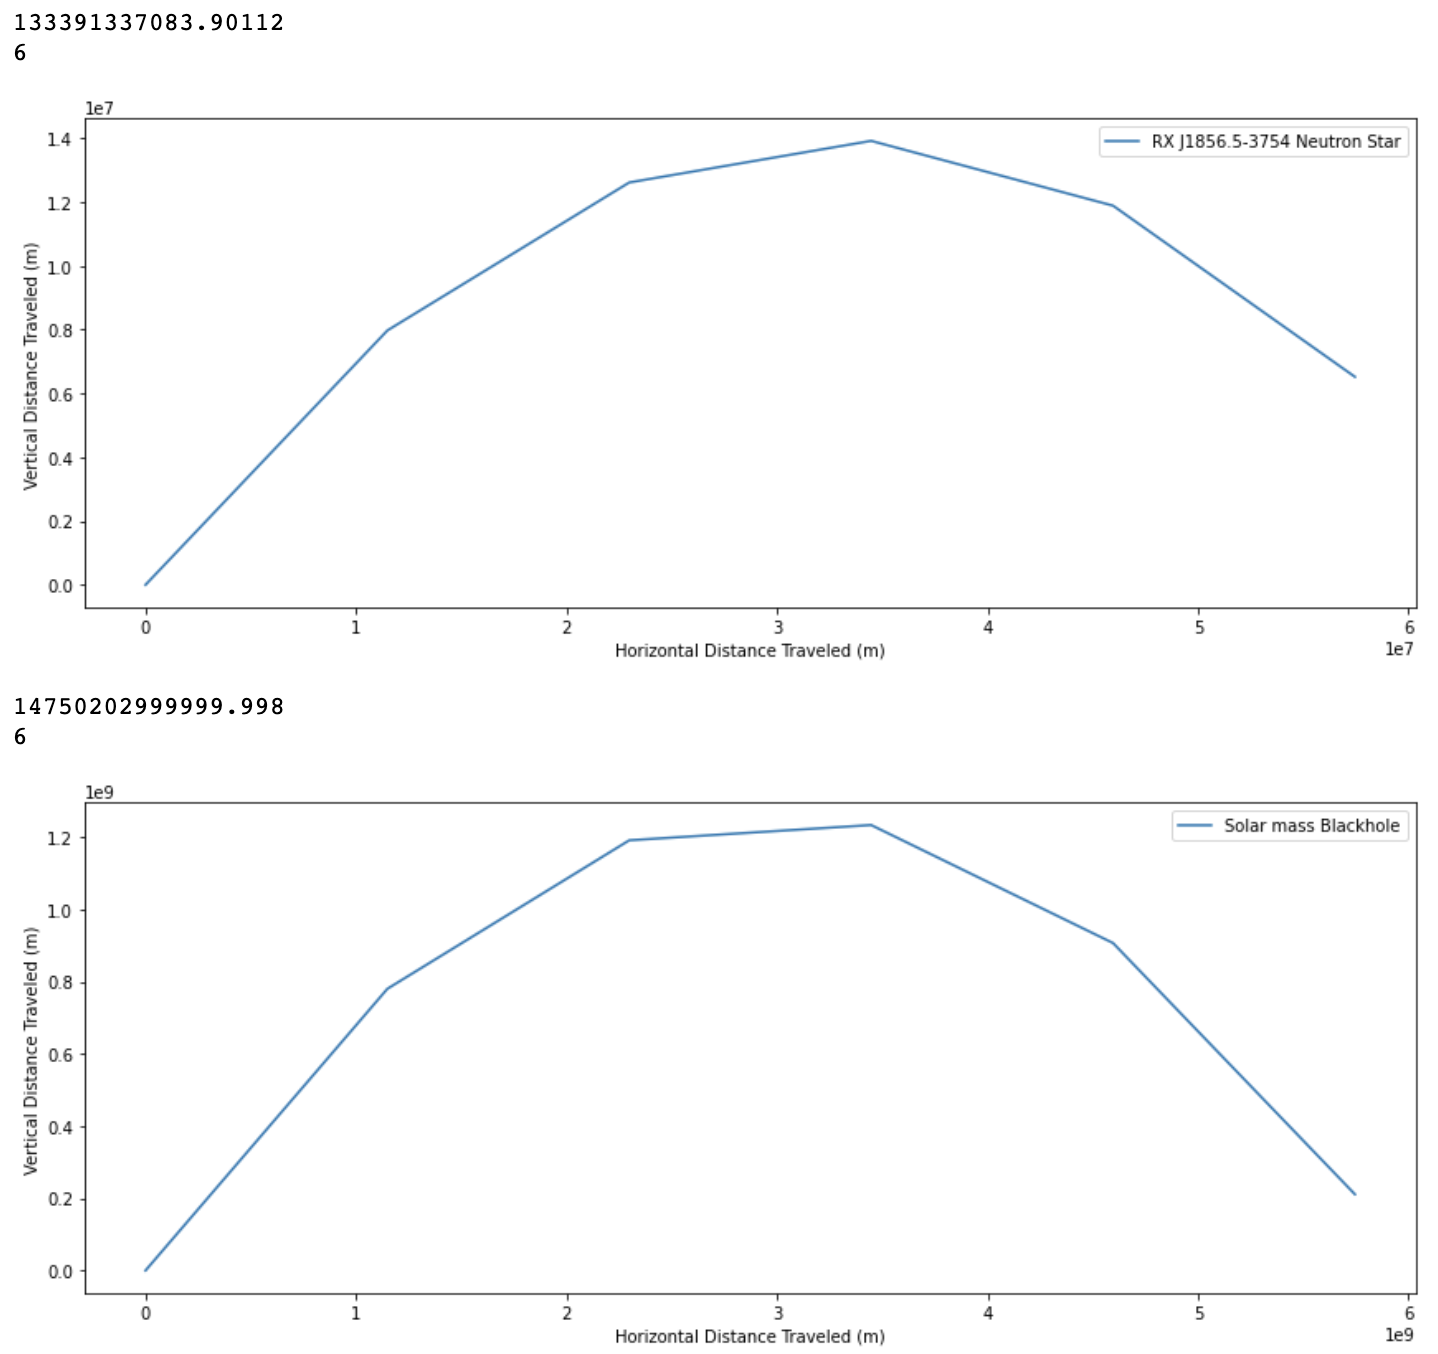
This plot graphs the projectile motion of a ball being thrown at a velocity of 3e9m/s on the neutron star and at a velocity of 3e11 on the solar mass blackhole at an intitial vertical height of 1.7m after calculating its gravity on each.
This plot animates the graph of the projectile motion of a ball being thrown at a velocity of 300 times the speed of light on on a neutron star.
About
My name is Neshini Sathishkumar and I am currently a junior in Heritage High School aspiring to be an astronomer. By joining a course in Frisco ISD, known as Independent Study and Mentorship (ISM), I have been able to contact other professionals in this field, conduct research and overall solidify my goal to be an astronomer. You can read and learn more about the ISM course here. And if you want to learn more about me and my research visit the website below:
My website
This year, I have had the honor of having Ms.Taylor Hutchison as my mentor.Taylor Hutchison is an astrophysicist and NSF Graduate Fellow at Texas A&M University. She works with some of the most distant galaxies ever discovered, ones which existed when the Universe was barely one billion years old -- meaning their light traveled over 12.7 billion years to reach our telescopes. Through her guidance I was able to create this website, learn how to create and use a github account, and finally learn about python and apply it into these four different projects.
Elements
Text
This is bold and this is strong. This is italic and this is emphasized.
This is superscript text and this is subscript text.
This is underlined and this is code: for (;;) { ... }. Finally, this is a link.
Heading Level 2
Heading Level 3
Heading Level 4
Heading Level 5
Heading Level 6
Blockquote
Fringilla nisl. Donec accumsan interdum nisi, quis tincidunt felis sagittis eget tempus euismod. Vestibulum ante ipsum primis in faucibus vestibulum. Blandit adipiscing eu felis iaculis volutpat ac adipiscing accumsan faucibus. Vestibulum ante ipsum primis in faucibus lorem ipsum dolor sit amet nullam adipiscing eu felis.
Preformatted
i = 0;

while (!deck.isInOrder()) {
    print 'Iteration ' + i;
    deck.shuffle();
    i++;
}

print 'It took ' + i + ' iterations to sort the deck.';
Lists
Unordered
- Dolor pulvinar etiam.
- Sagittis adipiscing.
- Felis enim feugiat.
Alternate
- Dolor pulvinar etiam.
- Sagittis adipiscing.
- Felis enim feugiat.
Ordered
- Dolor pulvinar etiam.
- Etiam vel felis viverra.
- Felis enim feugiat.
- Dolor pulvinar etiam.
- Etiam vel felis lorem.
- Felis enim et feugiat.
Icons
Actions
Table
Default
| Name |
Description |
Price |
| Item One |
Ante turpis integer aliquet porttitor. |
29.99 |
| Item Two |
Vis ac commodo adipiscing arcu aliquet. |
19.99 |
| Item Three |
Morbi faucibus arcu accumsan lorem. |
29.99 |
| Item Four |
Vitae integer tempus condimentum. |
19.99 |
| Item Five |
Ante turpis integer aliquet porttitor. |
29.99 |
|
100.00 |
Alternate
| Name |
Description |
Price |
| Item One |
Ante turpis integer aliquet porttitor. |
29.99 |
| Item Two |
Vis ac commodo adipiscing arcu aliquet. |
19.99 |
| Item Three |
Morbi faucibus arcu accumsan lorem. |
29.99 |
| Item Four |
Vitae integer tempus condimentum. |
19.99 |
| Item Five |
Ante turpis integer aliquet porttitor. |
29.99 |
|
100.00 |